To better understand what the corn market is pricing in now (and what is to come), traders should always be thinking ahead…
FORWARD VIEW: Looking ahead to the 2018/19 U.S. Corn Supply and Demand and what the price implications might be for December 2018 Corn Futures?
- Recently a notable private feed grains analyst issued its initial U.S. planted corn acreage estimate for 2018 of 91.9 million acres, 1 million acres higher than this year’s figure of 90.9 million. Based on that type of acreage figure, I would anticipate a very similar 2018/19 U.S. corn S&D to present with U.S. corn ending stocks likely in a position to exceed 2.0 billion bushels for the 3rd consecutive crop year (see full theoretical 2018/19 U.S. Corn Balance Sheet below).
- Now clearly there are a number of moving parts between now and the 2018 corn harvest (including the obvious – U.S. summer growing weather, corn/soybean economics, and South American corn/soybean production). That said the key takeaway is this, from a trader’s point of view, the perception will be that with planted acreage of 91.9 million acres, a “trend-line” yield of 171.0 BPA, and carryin stocks of 2.335 billion bushels, the USDA’s May 2018/19 U.S. Corn S&D table isn’t likely to generate much excitement from the Managed Money investor hoping for a return to $5.00 Dec corn. Even if we assume total 2018/19 U.S. corn demand of 14.550 billion bushels (+300 million from 2017/18), based on the aforementioned supply-side estimates which collectively exceed 16.8 billion bushels, the 2018/19 U.S. corn carryout on paper pencils back at 2.281 billion bushels. This equates to a healthy stocks-to-use ratio of 15.7%.
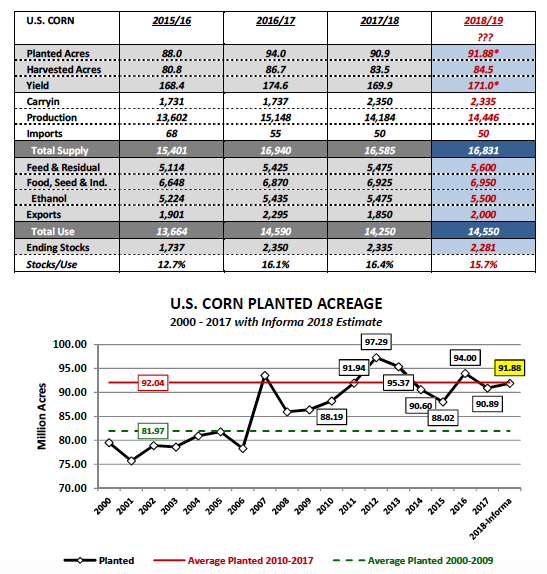
- What has to happen to change the view on next year’s May 2018/19 U.S. Corn S&D? The market needs to see a measurable downward acreage correction in corn. Since 2010 the U.S. farmer has planted on average 92 million acres of corn with a low-to-high range of 88 million in 2015 versus 97.3 million in 2012. Comparatively speaking the average from 2000 through 2009 was 82 million planted acres with a low-to-high range of 75.7 million in 2001 versus 93.5 million in 2007. Now clearly substantial U.S. corn-ethanol demand increases of approximately 2.0 billion bushels from 2007/08 (3.026 billion bushels) to 2010/11 (5.021 billion bushels) necessitated the expansion in both U.S. planted corn acreage, as well as, U.S. corn yield optimization from 2007/08 forward.
However since 2010/11 U.S. corn-ethanol demand has now only increased approximately 475 million bushels. The other two major U.S. corn demand sectors (exports, feed & residual use) have both experienced inconsistent gains and losses in usage from crop year to crop year. Meaning…there has been no discernible growth trend in either category. Therefore without consistent increases in U.S. corn-ethanol demand specifically the U.S. corn market is now entering a period where traders can’t see how usage exceeds 14.5 to 14.6 billion bushels anytime in the foreseeable future. In fact even in the USDA’s Baseline S&D report released in February 2017 (titled “USDA Agricultural Projections to 2026”) the USDA didn’t forecast total U.S. corn demand moving past 14.6 billion bushels until 2023/24.
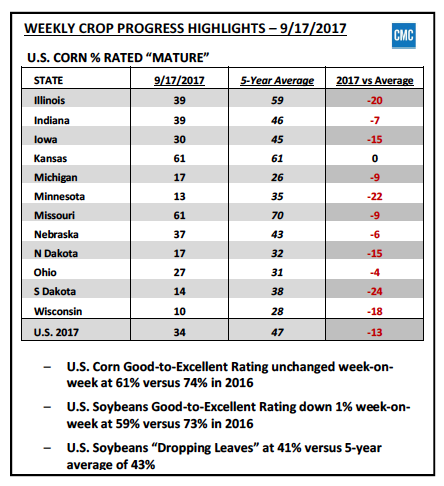
Make no mistake this is a problem for Corn Bulls. It has effectively reduced the Bullish argument every spring and summer to lower planted acreage and/or a summer drought, both supply-side variables that have more to do with weather than economics. Furthermore over the last 4-crop years the U.S. corn yield has now averaged 171.0 BPA, which includes the USDA’s recent September forecast of 169.9 BPA for 2017/18. This year’s yield has thus far held up despite variable growing conditions and below-average crop condition ratings in several key corn producing states.
Overall, then what’s the fastest, surefire way to raise the floor in corn futures prices? The U.S. farmer needs to plant less corn next spring…period. Consider the following, even with a 2018/19 U.S corn yield of 171.0 BPA, if planted corn acreage declined to 87.5 million acres (leaving carryin stocks, imports, and usage unchanged versus my theoretical U.S. corn 2018/19 S&D model) U.S. corn ending stocks would fall to 1.532 billion bushels. Now that’s a number Money Managers would trade. Under that scenario, even the suggestion of a below-trend U.S. corn yield would likely lead to rallies back to and above $5.00 in Dec corn futures. However until then…I can’t see why a producer shouldn’t price/sell something on a rally back to $4.10 to $4.20 per bushel in December 2018 corn futures between now and March 2018.
The reality is until the market perceives the risk of a year-on-year U.S. corn acreage reduction, traders likely won’t be interested in accruing a sizable net long position in corn futures.
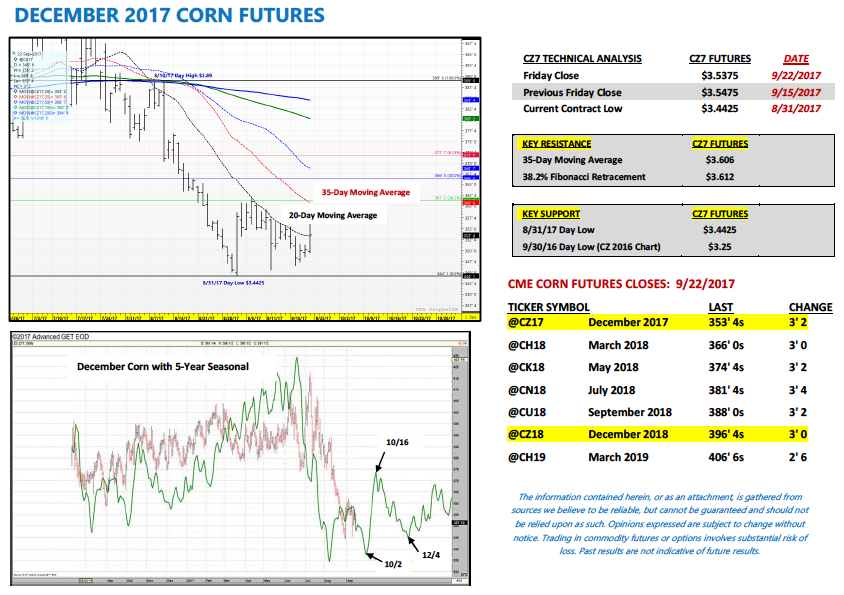
CZ7 SHORT-TERM PRICE OUTLOOK:
December corn closed slightly lower on the week, finishing down 1-cent per bushel at $3.53 ½. Friday’s Commitment of Traders report showed the Managed Money net short increasing to -134,606 contracts. Despite Money Managers adding to their short corn positions, CZ7 managed to close over the 20-day moving average on Friday afternoon. The next layer of overhead price resistance is the 35-day moving average at $3.60 ¾. I still believe rallies above $3.60 will be difficult to sustain short-term. Early corn yield results remain largely “better than expected.”
Twitter: @MarcusLudtke
Author hedges corn futures and may have a position at the time of publication. Any opinions expressed herein are solely those of the author, and do not in any way represent the views or opinions of any other person or entity.
Data References:
- USDA United States Department of Ag
- EIA Energy Information Association
- NASS National Agricultural Statistics Service

: Worrisome to Broader Market?")


