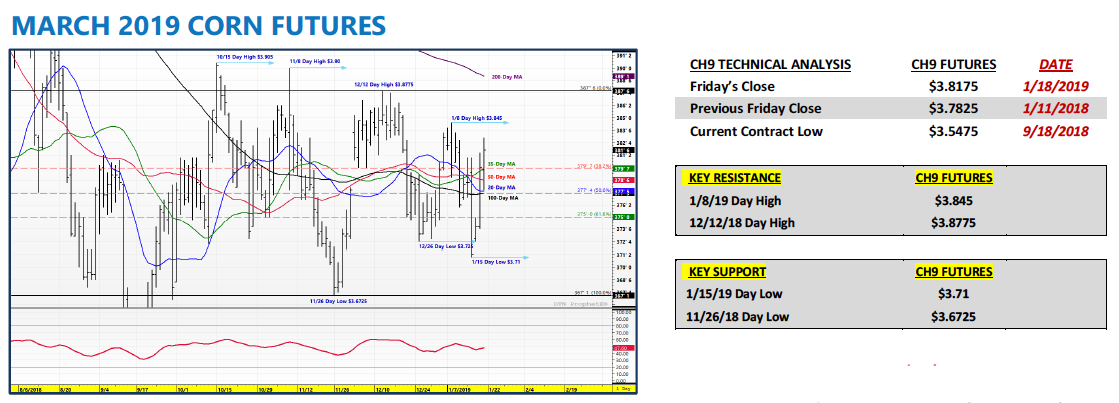
March corn futures closed up over 3 cents last week, finishing near $3.82.
Traders continue to digest a heavy dose of news as 2019 gets underway. Let’s review several of these key news pieces, along with current market data and trends.
China – U.S. Trade Update: China released its 2018 trade figures this week, which showed December 2018 soybean imports of 5.72 MMT; the lowest total for December since 2011.
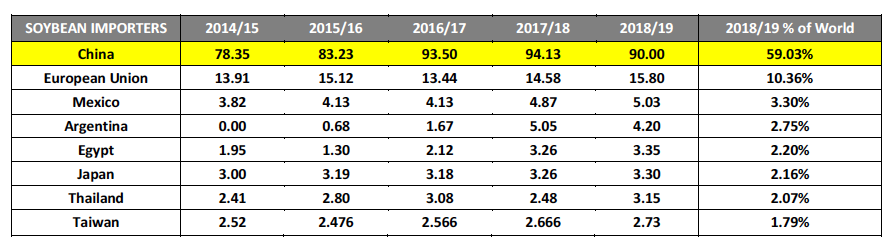
Furthermore China’s total 2018 soybean imports were down 7.9% versus a year ago; representing the first annual decline in soybean imports since 2011. China is the world’s largest importer of soybeans accounting for nearly 60% of total world soybean imports (top soybean importers below).
On Monday President Trump defended his trade policies, focusing specifically on China, at the American Farm Bureau Federation annual convention in New Orleans.
China’s retaliatory tariff of 25% on U.S. soybeans has been a significant factor in the continued weakness of U.S. soybean prices; with China shifting the vast majority of its soy purchases to Brazil over the last 6-months. It’s worth noting that in 2017 China accounted for more than 60% of all U.S. soybean exports (+1.200 billion bushels). Therefore losing access to China’s soybean market has been (and continues to be) a devastating blow to U.S. farmers.
On Tuesday China’s immediate market influence was made even more apparent after Reuters reported that Senator Chuck Grassley indicated that United States Trade Representative Robert Lighthizer “saw little progress on key issues in last week’s trade talks with China.”
March 2019 soybean futures responded by closing down 10 ¼-cents per bushel Tuesday afternoon, finishing at $8.93 ¼. March 2019 corn futures closed down 7 ¼-cents per bushel, finishing at $3.71 ¼.
I remain of the opinion that the trade war with China has disproportionately affected U.S. farmers relative to other industries/sectors of the U.S. economy.
Examining soybean futures specifically the average front-month soybean futures price from March – May 2018 was $10.32 per bushel. Comparatively the average front-month soybean futures price from July – Dec 2018 was $8.64 per bushel. This equates to a 16.3% price decline in the futures price alone, with physical soybean basis levels also depreciating considerably further escalating the decrease in actual cash values received by farmers.
China’s 25% tariff on U.S. soybeans went into effect on July 6th, 2018. And while I’ll acknowledge that this year’s record U.S. soybean yield has also factored into the continued price weakness, I feel strongly that if China’s market was back open, unimpeded by tariffs or trade tensions with the U.S., soybean futures would be trading at least 50 to 75-cents per bushel higher than they are currently. Soybean traders would likely be less fixated on record U.S. soybean ending stocks if they felt better about U.S. demand prospects moving forward.
WEEKLY EXPORT INSPECTIONS: The USDA’s Weekly Export Inspections report showed U.S. soybean shipments of 39.9 million bushels for the week ending January 10th, 2019.
Crop year-to-date U.S. soybean inspections improved to 675.8 million bushels, however that total remains 40% less than a year ago or -457.8 million bushels. Meanwhile in corn, weekly U.S. corn inspections totaled 39.9 million bushels, resulting in crop year-to-date U.S. corn shipments of 766.5 million bushels (+61% versus 2017/18).
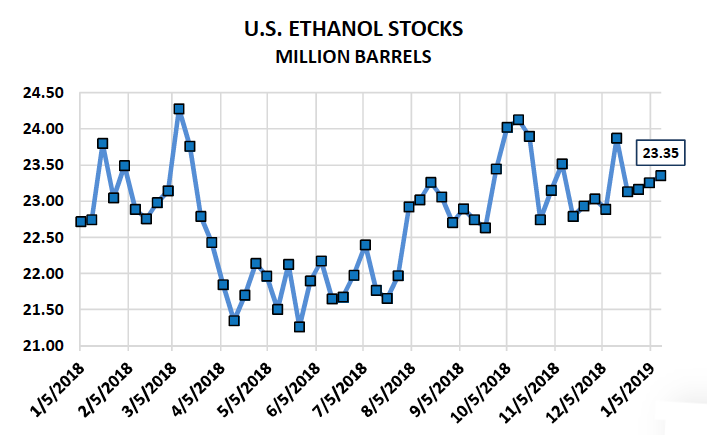
U.S. ETHANOL PRODUCTION SURGES: Wednesday’s EIA report showed weekly U.S. ethanol production ramping back up considerably.
For the week ending January 11th, 2019, U.S. ethanol production averaged 1.051 million barrels per day versus 1.000 mmbpd the week prior and the 4-week average of 1.026 mmbpd. U.S. ethanol stocks increased to 23.351 million barrels, the fourth consecutive weekly increase. Ethanol futures have been under pressure since the release of the report with February ethanol trading back under $1.26 per gallon. Industry average ethanol margins have backtracked 17 cents per bushel since Monday and are now penciling in at approximately a negative52 cents per bushel (-17.6 cents per gallon). Needless-to-say the industry ramping back up production was clearly too much too soon.
MARCH CORN FUTURES TRADING OUTLOOK
The ebb and flow regarding China – U.S. trade negotiations shifted again late in the week with reports surfacing that U.S. Treasury Secretary Mnuchin suggested lifting some or all tariffs on Chinese imports. Those comments were enough to generate recoveries in both corn and soybean futures on Thursday and Friday.
Does the Mnuchin narrative change my view on the progress of China – U.S. trade talks? No. In my opinion it was used to soften (or neutralize) the more pessimistic Grassley/Lighthizer comments from Tuesday, which had the markets (both equities and commodities) once again on the defensive. I’m guessing it was a predetermined move on the part of the Trump Administration to calm investor sentiment.
TECHNICALLY… if you examine the price action in March corn futures closely, CH9 has simply traded in approximately a 20-cents per bushel range since November 9th(low = $3.67 ¼, high = $3.87 ¾). The average March corn close over that time period has been approximately $3.79 per bushel. Compare this to Friday’s close at $3.81 ¾ and you can see March corn really hasn’t gone anywhere other than trade back and forth within a fairly well-established and narrow trading range for over two months.
Corn and Soybean Bulls continue to push the Brazil drought angle; however the reality is that storyline hasn’t been enough to push either commodity through the upper end of its current trading range. Furthermore, I’m not convinced it can at this time. Looking ahead to next week, until March corn futures can establish a close over key price resistance from $3.87 ¾ (day high on 12/12/18) to $3.89 (200-day moving average), I still see CH9 as essentially range bound. With the U.S. government shut down, the market still isn’t able to receive any weekly export sales confirmations, monthly WASDE reports, and/or weekly Commitment of Traders summaries. This has further impeded market transparency and in my opinion resulted in an unwillingness from Money Managers specifically from adding longs at or near key resistance levels.
Twitter: @MarcusLudtke
Author hedges corn futures and may have a position at the time of publication. Any opinions expressed herein are solely those of the author, and do not in any way represent the views or opinions of any other person or entity.
Data References:
- USDA United States Department of Ag
- EIA Energy Information Association
- NASS National Agricultural Statistics Service


