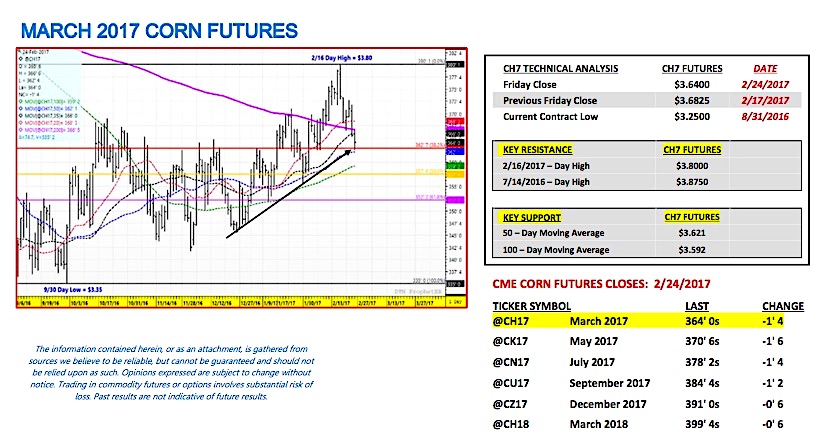
March corn futures moved lower last week, closing down 4 ¼-cents per bushel week-on-week, finishing on Friday (2/24) at $3.64. March corn futures are now 16-cents per bushel removed from the prior week’s day high of $3.80 (2/16).
Friday’s March Corn futures (CH7) close was below both the 35 and 200-day moving averages.
WEEKLY MARKET HIGHLIGHTS (2/21 – 2/24):
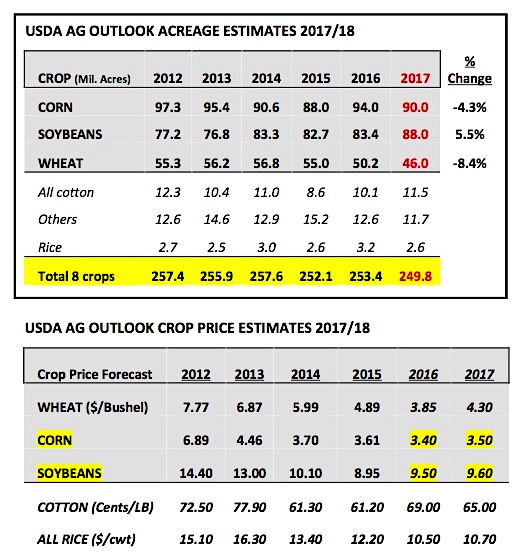
The 93rd annual Agricultural Outlook Forum took place this week on Thursday and Friday in Arlington, Virginia, offering the USDA’s latest S&D expectations for the 2017/18-crop year. Corn and Soybean Bulls were highly anticipating any potential adjustments to 2017 planted acreage for both U.S. corn (NYSEARCA:CORN) and soybean crops versus the USDA’s “Baseline” estimates released in November. In the USDA’s November “Baseline” projections 2017/18 U.S. planted corn acreage was forecasted at 90.0 million acres with soybean acres estimated at 85.5 million acres. On Thursday morning, with USDA Chief Economist Rob Johansson presenting, the USDA’s planted corn acreage forecast was left unchanged at 90 million acres; however the USDA increased its planted soybean acreage estimate to 88.0 million acres. The revised acreage forecast for soybeans now brings the USDA’s analysis closer in-line with several recent “private” estimates that have ranged from 88.6 million acres to as high as 90.5 million soybean acres.
What was the foundational argument for what would be a 5.5% planted acreage increase in U.S. soybeans for 2017?
Johansson pointed to the new crop soybean-to-corn price ratio during the month of February as the primary justification for the sizable increase in soybean acres. That ratio simply divides November 2017 soybean futures by December 2017 corn futures. A presumed economic advantage is then implied regarding planting either soybeans or corn based on anticipated input costs and projected yields. February is critical due to Crop Insurance and Revenue Guarantee Programs being established that month, which are derived from the February monthly average of the CME futures closes for both December corn futures and November soybean futures. At February month-end, producers then evaluate the soybean / corn revenue guarantee prices and adjust if necessary their final planted acreage intentions for the upcoming spring. It should be noted that weather during the planting season, as well as, preferred crop rotations also play major roles in determining a producer’s planted acreage balance every spring.
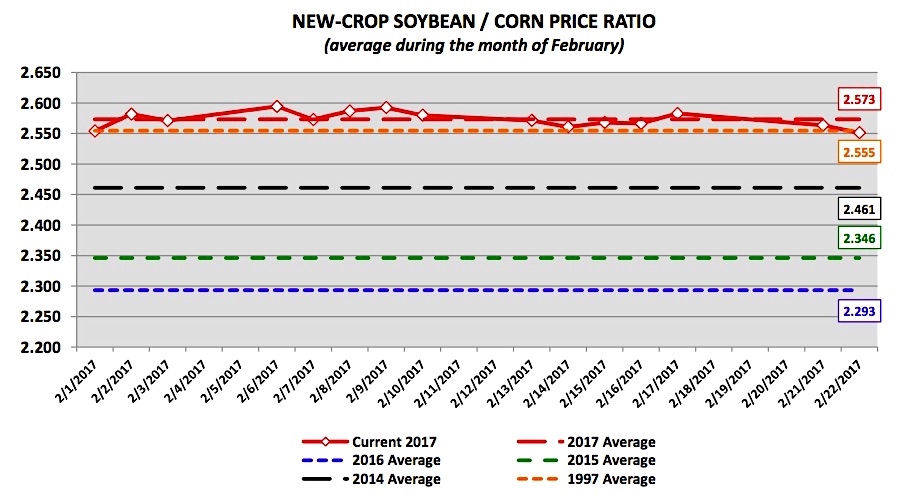
As the chart above illustrates, the current average new crop soybean-to-corn price ratio during the month of February (as of the market close on 2/22/17) has been 2.573. Johannsson reiterated that this price ratio is the highest it’s been since 1997, with a more recent comparison coming in 2014 when it averaged 2.461. That crop year 2014/15 U.S. soybean planted acreage increased 7 million acres or +8.5% versus 2013/14. Therefore the USDA believes a similar pattern or shift to increased soybean acres will now also occur in 2017 due almost exclusively to the economic advantage new crop soybean futures currently hold over new crop corn futures.
How accurate are the USDA’s Ag Outlook planted acreage estimates? In 2016 the USDA underestimated final planted U.S. corn acreage by 4 million acres at the Ag Outlook Forum. They also underestimated final planted U.S. soybean acreage by 0.9 million acres. Therefore these forecasts are still prone to substantial changes going forward, regardless of new crop soybean-to-corn futures price ratios. The limitations of using that ratio as the primary indicator for predicting major shifts in the soybean/corn acreage balances are many including it fails to factor in regional basis levels and the actual cash prices producers can expect to receive for each crop both at harvest and throughout the course of the marketing year (basis = equals the differential between the futures price and the cash price farmers get when they physically sell and deliver their corn/soybeans). Input costs also vary across the Corn Belt. And finally, as I mentioned previously, spring planting weather has a tremendous influence on final planted acreage figures.
Final takeaway on the USDA’s Ag Outlook 2017 PLANTED Acreage Estimates: If I’m a Corn Bull I’m happy with the USDA’s Ag Outlook estimate of 90 million corn acres. I would have preferred something under-90 million for additional sticker shock; however the reality is now the market is at a minimum forced to contemplate the possibility of a 160 bpa type yield in 2017/18 on 4 million less acres (versus 2016/17). Total 2017/18 U.S. corn production on 82.4 million harvested acres and a yield of 160 bpa equates to 13,184 million bushels (-1,964 million bushels versus 2016/17).
That thread of “what-if” regarding the possibility of a slightly below-trend yield this summer following 3-record setting yield scenarios from 2014 – 2016 should be enough to keep a bid in the corn market throughout the spring even with massive carryin stocks currently estimated at 2,320 million bushels.
KEY CH7 PRICING CONSIDERATIONS FOR THE WEEK ENDING 2/24/2017: March corn futures (CH7) closed on Friday (2/24) at $3.64 finishing down 4 ¼-cents per bushel week-on-week.
Key takeaways from this week’s price action:
- On Friday the USDA released its 2017/18 U.S. corn and soybean balance sheets from the Ag Outlook Forum. At face value neither S&D looks particularly promising with respect to providing a favorable storyline for initiating sustainable springtime rallies. 2017/18 U.S. corn ending stocks were estimated at 2,215 million bushels (down just 105 million bushels from 2016/17) with U.S. soybean ending stocks forecasted at 420 million bushels (unchanged from 2016/17). Additionally to keep soybean ending stocks static year-on-year the USDA was compelled to raise total 2017/18 U.S. soybean demand to 4,205 million bushels, a record high and up nearly 100 million bushels from 2016/17. In particular 2017/18 U.S. soybean exports were estimated at 2,125 million bushels, 75 million bushels above 2016/17 despite record South American soybean production looming this crop year, which will invariably compete with U.S. soybeans in the world export market going forward. Point being…I’m not sure anyone’s going to gravitate to the USDA’s optimistic usage forecasts, which are needed to prevent further stocks builds in 2017/18. Invariably for Corn and Soybeans Bulls it will come down to yield in 2017/18. Below-trend yields (or the perception of that occurring) will likely be required to create 50-cent to $1.00 per bushel rallies from current price levels.
- Technically it was not a good close for Corn Bulls on Friday with March corn futures closing below both the 35 and 200-day moving averages. CH7 did hold the 50-day moving average at $3.621 despite briefly challenging that level during the session. Next week March corn futures need to hold key support at the 100-day moving average at $3.591 to avoid a deeper correction back to the low $3.50’s. Ultimately Corn Bulls will need to exercise patience until U.S. “weather” becomes more of a dominant focal point in March, April, and May.
Thanks for reading.
Twitter: @MarcusLudtke
Author hedges corn futures and may have a position at the time of publication. Any opinions expressed herein are solely those of the author, and do not in any way represent the views or opinions of any other person or entity.
Data References:
- USDA United States Department of Ag
- EIA Energy Information Association
- NASS National Agricultural Statistics Service

: Worrisome to Broader Market?")
