May corn futures closed down 5 1/2-cents per bushel week-on-week, finishing at $3.77 1/4.
Let’s review the latest corn news, USDA data, and analysis for the week ahead (March 26).
Weekly Highlights & Takeaways
This week the focus shifted to the USDA’s upcoming release of its 2018 Prospective Plantings report on March 29th. There has been considerable debate about how many corn acres the U.S. could lose relative to a year ago with the USDA’s latest estimate from the Ag Outlook Forum of 90 million acres not substantially less than 2017/18 U.S. corn planted acreage of 90.167 million acres. HOWEVER in recent weeks there have been several private acreage estimates well below 90 million acres with Informa Economics the latest to follow that trend. They forecasted 2018/19 U.S. corn planted acreage of 88.92 million acres, down 1.247 million acres from 2017/18. I personally am expecting to see an acreage figure closer to 89.5 million in next Thursday’s report.
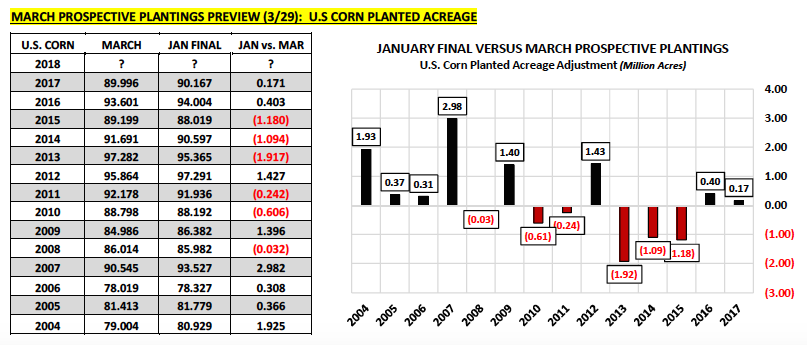
How accurate has the March Prospective Plantings corn acreage estimate been versus the USDA’s FINAL planted acreage figure the following January? Surprisingly fairly accurate. For example in 2017 the USDA’s final January acreage figure of 90.167 million acres was just 171,000 acres higher than the USDA’s forecast in March (less than a 1% acreage adjustment). Longer-term, since 2004 the USDA’s final January acreage figure has been higher than its March forecast on 8 occasions by an average of +1.12 million acres. The largest January versus March planted acreage increase over that time period was +2.982 million acres in 2007. Conversely there have been 6 planted acreage declines since 2004 averaging -0.845 million acres. The largest January versus March planted acreage decline coming in 2013, which totaled -1.917 million acres.
Does this year’s Prospective Plantings report carry additional weight regarding the future price direction in corn futures? I believe so. In the March 2018 WASDE report the USDA effectively lowered probable 2018/19 U.S. corn carryin stocks to 2.127 billion bushels versus 2.352 billion bushels the month prior.
That carryin stocks adjustment of -225 million bushels combined with 2018 U.S. corn planted acreage of 89.5 million acres, raises the ante considerably on the U.S having another exceptional summer growing season. In my most recent 2018 U.S. corn S&D model below you will see that even with a yield of 171 bushels per acre in 2018/19, U.S. corn ending stocks could potentially slip to less than 1.6 billion bushels if U.S. corn-ethanol demand and exports remain strong. For this reason I am starting to get slightly more “Bullish” corn futures during the June/July/August timeframe.
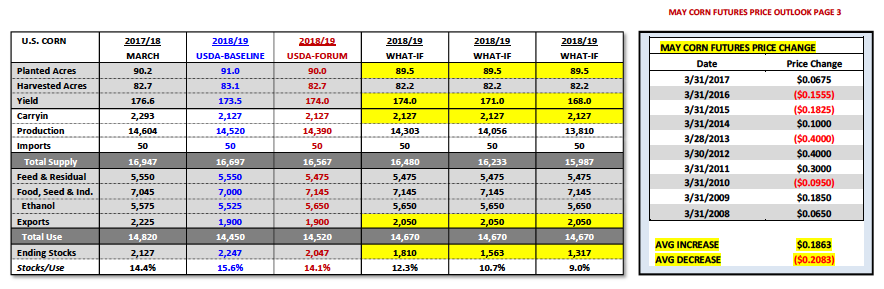
What type of price volatility should we expect on the day of the March Prospective Plantings report? Over the last 10-years (see below) there have been 6 higher closes averaging +18.6 cents per bushel on the day of the March Prospective Plantings report. This compares to 4 lower closes averaging -20.8 cents per bushel. There have also been 3 “Limit” up/down moves on the day of this report since 2008. Needless-to-say, traditionally the March Prospective Plantings report has generated considerable price volatility; however without a definitive up or down price trend. The takeaway seems to be…make sure you positioned accordingly for potentially a 15-cent price swing next Thursday. Look for a summary in my next weekly report.
MAY 2018 CORN FUTURES PRICE FORECAST:
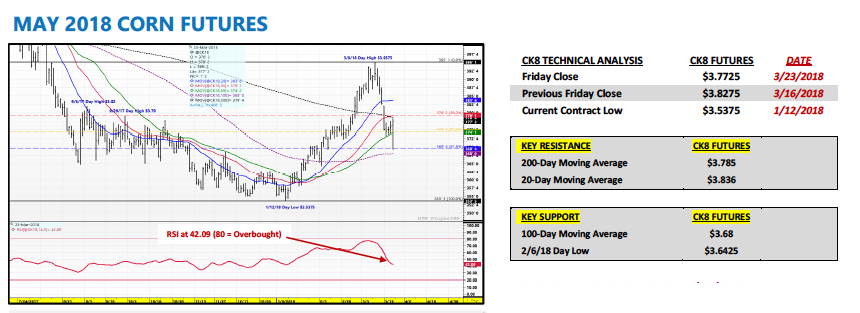
May corn futures closed down 5 ½-cents per bushel week-on-week, finishing at $3.77 ¼ on Friday afternoon.
Despite the lower weekly close Friday’s price action was actually quite impressive for Corn Bulls. Early in the session May corn traded down to a day low of $3.69 ¼ (lowest level since 2/6/18), stopping just shy of the 100-day moving average at $3.68. However as the session progressed more and more buyers started coming back into the market, which allowed May corn futures to actually close higher on the day (up 1 ½-cents per bushel).
Technically even though May corn futures remain 16 ½-cents per bushel below the 3/8 day high of $3.93 ¾, corn prices remain in an uptrend. That said I would expect considerable price volatility next week with the aforementioned March Prospective Plantings report being released on Thursday, 3/29. If the USDA offers a 2018 U.S. corn planted acreage estimate at or below 89.0 million it’s quite possible May corn futures could over time challenge the 3/8 day high.
Also worth noting…the 5-year price seasonal in corn is now higher moving into mid-April. That said the price pattern is far from consistently higher, suggesting future rallies will continue to experience minor downward corrections along the way.
Twitter: @MarcusLudtke
Author hedges corn futures and may have a position at the time of publication. Any opinions expressed herein are solely those of the author, and do not in any way represent the views or opinions of any other person or entity.
Data References:
- USDA United States Department of Ag
- EIA Energy Information Association
- NASS National Agricultural Statistics Service


