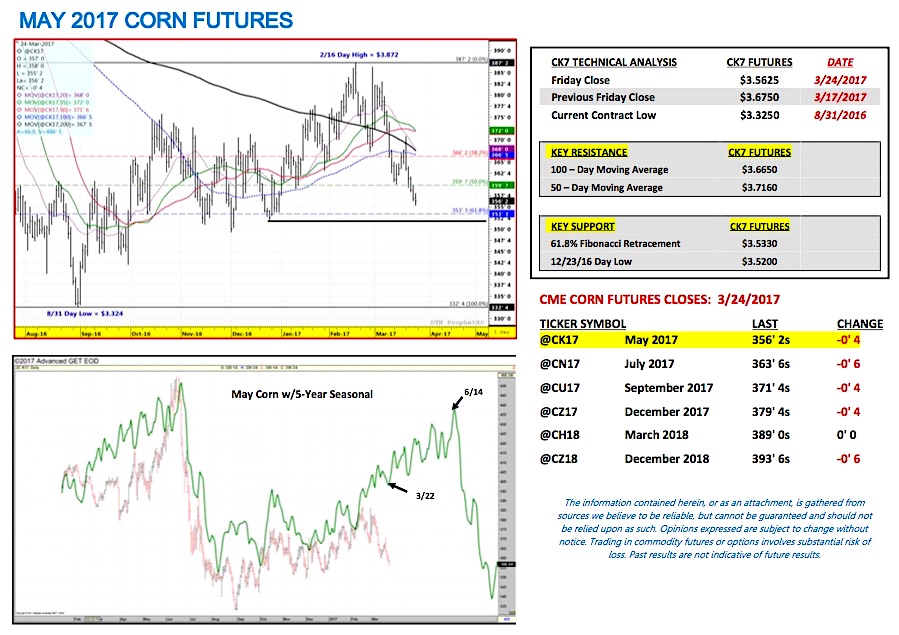
May corn futures moved sharply lower this week, closing down 11 ¼-cents per bushel week-on-week, finishing on Friday (3/24) at $3.56 ¼.
Friday’s close was the lowest in May corn futures since December 29, 2016… clearly not a good technical sign for Corn Bulls. this drove the Corn ETF (NYSEARCA:CORN) lower as well.
There remain a number of technical and fundamental price drivers weighing on corn futures including recent dialogue concerning next week’s March 31st Prospective Plantings report.
A LOOK AHEAD TO THE MARCH 31st PROSPECTIVE PLANTINGS REPORT: On March 31st the USDA will release its March Prospective Plantings report for 2017. This report historically has had a sizable market influence on corn and soybeans futures price direction during the April-May timeframe. Some key considerations are as follows:
The planted acreage figures issued in the Prospective Plantings report will eventually be applied to the USDA’s initial 2017/18 U.S. corn and soybeans supply & demand balance sheets released in the May 2017 WASDE report. Therefore if the USDA offers acreage projections that are perceived as being higher than expected (i.e. U.S. corn planted acreage above 90 million and U.S. soybeans planted acreage above 88 million), they will likely serve as additional overhead price resistance, weighing on both corn and soybeans futures prices over the next two months.
The hope for sustainable April/May rallies in both commodities has largely been predicated on a combination of lower than expected prospective plantings and some semblance of a tangible planting delay in at least one key area of the Corn Belt. That said if the acreage forecasts are deemed as being more than sufficient, corn and soybeans Bulls will be reduced to playing the weather card in early April regarding trying to create a spring storyline supporting higher prices. It’s worth noting this did essentially work in April, May, and June of 2016 with La Niña speculation running rampant, which fostered a low to high price move in December corn futures of 85-cents per bushel from April 1st through June 17th ($3.64 day low on 4/1 versus a day high of $4.49 on 6/17). However given how quickly that rally fell apart immediately thereafter following a significantly wetter weather pattern, I’m assuming corn buyers will be much more hesitant before chasing the La Niña narrative for a second consecutive year.
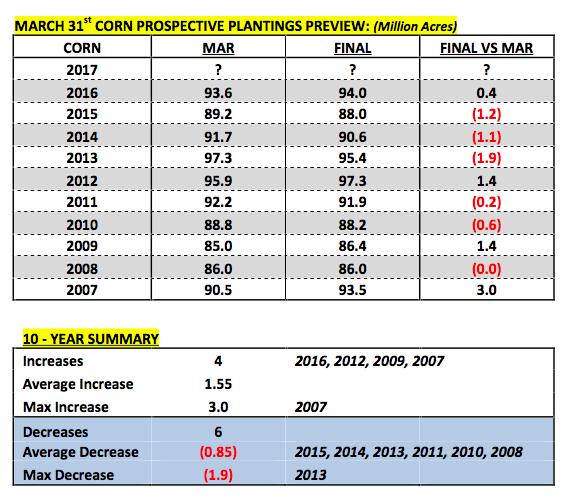
How accurate are the USDA’s March Prospective Plantings forecasts? How much “stock” do traders put in such early growing season acreage estimates? 10-year data would suggest both the USDA’s corn and soybean March Prospective Plantings forecasts are extremely accurate. In corn the USDA’s March planted acreage estimate has been within 2% of the Final figure in 9 out of the last 10-years (only exception was 2007).
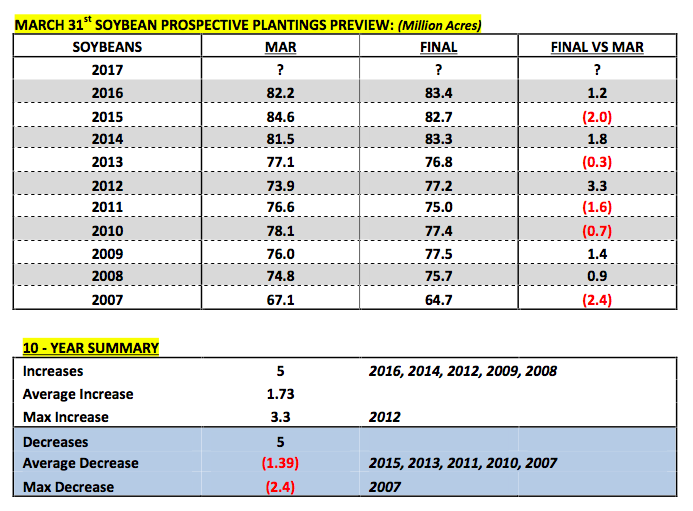
Over that time there have been 4 increases averaging 1.55 million acres with a max increase of 3.0 million acres in 2007 versus 6 decreases averaging just 0.85 million acres and a max decrease of 1.9 million acres in 2013. In soybeans the USDA’s March planted acreage estimate has been within 2.4% of the Final figure in 8 out of the last 10-years (only exceptions were 2012 and 2007). This included 5 increases averaging 1.73 million acres with a max increase of 3.3 million acres in 2012 versus 5 decreases averaging 1.39 million acres and a max decrease of 2.4 million acres in 2007. Therefore traders certainly don’t dismiss the USDA’s March forecasts. This isn’t to say the market won’t try and anticipate potential acreage switching based on weather and corn/soybean economics throughout the course of the spring planting window; however what the data clearly indicates is that major acreage shifts remain unlikely.
Overall both corn and soybeans markets in my opinion have been ahead of themselves price-wise to the upside relative to real market fundamentals (both U.S. and World corn/soybeans S&D’s continue to offer large to record large ending stocks for 2016/17, thereby creating a huge supply cushion going into the 2017/18 growing season). That said this latest downward correction in futures prices seems long overdue (and the Soybeans ETF – NYSEARCA:SOYB).
Additionally the most recent private acreage estimates being released in advance of the March 31st Prospective Plantings report have now overwhelming shown corn acreage pushing higher versus the USDA’s Ag Outlook Forum forecast of 90 million. Informa Economics latest revised U.S. corn acreage forecast was 90.8 million. FCStone countered with its estimate of 91.6 million acres. Corn Bulls in particular are going to need some help stopping the slow bleed in corn futures due to what’s been a more consistently negative/Bearish forward view on supply side rallies for 2017/18.
Key May Corn Futures Pricing Considerations
May corn futures (CK7) closed on Friday (3/24) at $3.56 ¼ finishing down 11 ¼-cents per bushel week-on-week.
Key takeaways from this week’s price action:
- U.S. corn export sales continue to run at an accelerated rate with sales of 53.0 million bushels reported for the week ending 3/16/2017. Crop year-to-date (2016/17) export sales improved to 1,838.8 million bushels versus 1,214.6 million a year ago (+51.4%). South Korea, Japan, and Mexico were all key noted buyers. Corn Bulls continue to cheer strong U.S. corn export sales and shipments; however I’m still of the opinion the USDA will hesitate before increasing its current 2016/17 U.S. corn export projection of 2,225 million bushels (the highest since 2007/08’s 2,437 million bushels). Brazil’s safrinha corn crop is still weighing heavy on the sustainability of the current export pace for U.S corn sales June forward.
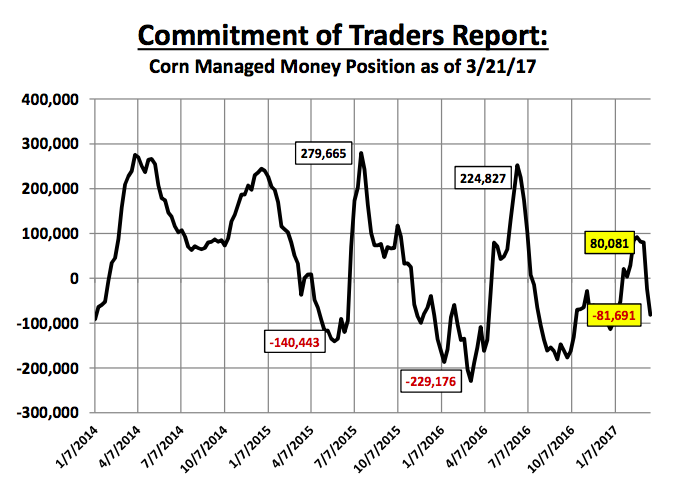
- Friday’s Commitment of Traders report showed money managers aggressive sellers of corn for the second consecutive week. As of the market close on 3/21 the Managed Money net short in corn had increased to -81,691 contracts. Just two Commitment of Traders reports prior that position was reported at a net LONG of +80,081 contracts (3/7). Therefore the massive money shift has continued, which has not surprisingly coincided with a 31-cents per bushel break in May corn futures from the 2/16 day high of $3.87 ¼ versus Friday’s day low of $3.56 ¼. However it is worth noting that last year on 3/22/16 the Managed Money short in corn was reported at -154,569 and yet that didn’t dissuade money managers from eventually returning as sizable buyers in May and June. By June 14th, 2016 that position had swung to a net LONG of +252,295 contracts, which resulted in July corn futures trading up to a day high of $4.39 ¼ on 6/8/16.
Once again…I still believe corn can and will rally; however those rallies will take time and weather speculation to evolve over the course of the spring and early summer in the Midwest.
Thanks for reading.
Twitter: @MarcusLudtke
Author hedges corn futures and may have a position at the time of publication. Any opinions expressed herein are solely those of the author, and do not in any way represent the views or opinions of any other person or entity.
Data References:
- USDA United States Department of Ag
- EIA Energy Information Association
- NASS National Agricultural Statistics Service


