May corn futures closed up 10 3/4-cents per bushel week-on-week, finishing at $3.85 1/4.
Let’s review the latest corn news, USDA data, and analysis for the week ahead (March 5).
Weekly Highlights and Takeaways
1. The resurgence in U.S. corn export business continued this week with weekly U.S. corn export sales for the 2017/18 crop year totaling 69.0 million bushels. Crop year-to-date U.S. corn export sales increased to 1.547 billion bushels versus 1.701 billion a year ago (-9.5%) as of the week ending 2/22/18. This begs the question how Bullish corn futures is the improving U.S. corn export outlook? In the USDA’s most recent monthly WASDE report, 2017/18 U.S. corn exports were forecasted at 2.050 billion bushels versus 2.293 billion in 2016/17 (please note the end of the 2017/18 export marketing year is August 31st, 2018). Therefore the USDA is anticipating an -8.9% export reduction compared to 2016/17.
What this then suggests is that even with a vastly improved weekly U.S. corn export sales pace since essentially the end of January, cumulative exports through 2/22/18 remain just off the pace necessary to meet the USDA’s current 2017/18 export sales projection (present pace -9.5% versus projected pace -8.9% relative to 2016/17).
Therefore I don’t feel there’s a strong justification for the USDA increasing its current U.S. corn export projection in the March 2018 WASDE report (released on Thursday, March 8th). If my line of thinking proves out, then I can’t see what pulls the 2017/18 U.S. corn carryout below 2.3 billion bushels moving forward. That type of carryout (which becomes 2018/19’s carryin stocks) combined with 2018 U.S. corn planted acreage of 90 million acres does not, in my opinion, support a move above $3.90 in May corn futures at this time.
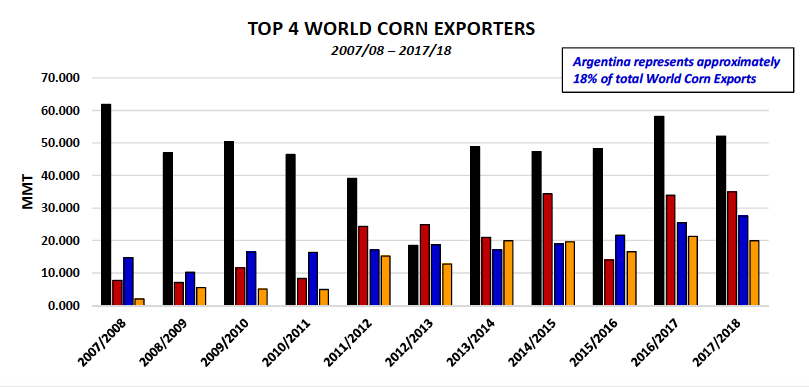
2. What’s driving the improvement in weekly U.S. corn export sales? S. corn exports continue to benefit from world corn buyers shifting a percentage of their ownership needs away from Argentina. Argentina remains in the midst of a devastating drought. This week Informa reduced its 2017/18 Argentina corn production forecast to 33.5 MMT. This compares to the USDA’s most recent estimate of 39 MMT in the February 2018 WASDE report. Argentina’s corn exports were forecasted at 27.5 MMT in that same report. I’m going to assume the USDA could lower Argentine corn exports as much as 2 MMT (78.7 million bushels) in next week’s March 2018 WASDE report. Will the majority of that business flow back to the United States? Not necessarily…the U.S. and Brazil will probably collectively work to displace lower Argentine corn exports. The U.S. is the world’s largest corn exporter representing 34% of total World corn exports followed by Brazil at 23%, Argentina at 18%, and Ukraine at 13%.
HOWEVER, the wild card moving forward is Brazil. Informa also lowered its 2017/18 Brazil corn production estimate to 89 MMT versus the USDA’s February production figure of 95 MMT. There are several traders who believe Brazil’s corn production is headed lower over time due to decreases in safrinha planted corn acreage. IF that proves to be true, the U.S. would likely be better positioned to exploit a larger share of Argentina’s evolving export void. That said the market won’t know the size and scope of Brazil’s safrinha corn production until June or July.
MARCH 2018 CORN FUTURES PRICE FORECAST:
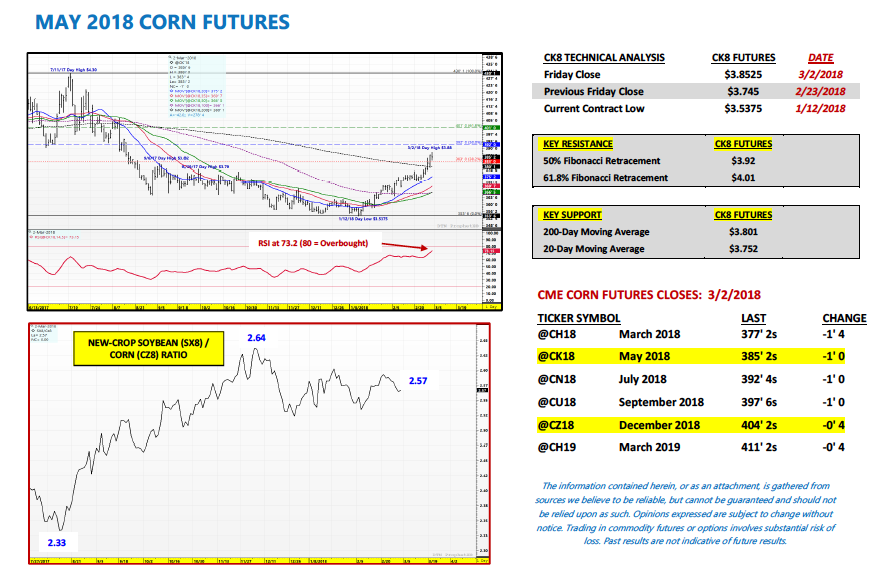
March 2018 corn futures traded up to its highest level since August 15th, 2017 on Friday, making a day high of $3.88. After pushing through the 200-day moving average on Wednesday, which had been acting as strong topside resistance, another round of Managed Money buying surfaced propelling corn futures sharply higher week-on-week. The question once again is “How long will this uptrend last?”
Friday’s Commitment of Traders report showed Money Managers weekly buyers of more than 40,000 corn contracts. As of Tuesday’s market closes (2/27) the Managed Money position in corn had increased to a net LONG of +59,120 contracts. It should be noted that in 2017 the Managed Money position on 2/28 was +82,135 contracts…HOWEVER by the end of March (on 3/28/17) that position had shifted to a massive net SHORT of -155,512 contracts. That corresponded with May 2017 corn futures trading back down under $3.55 on 3/27/17. The inference then being that the Money and corn prices rolled over during the month of March in 2017.
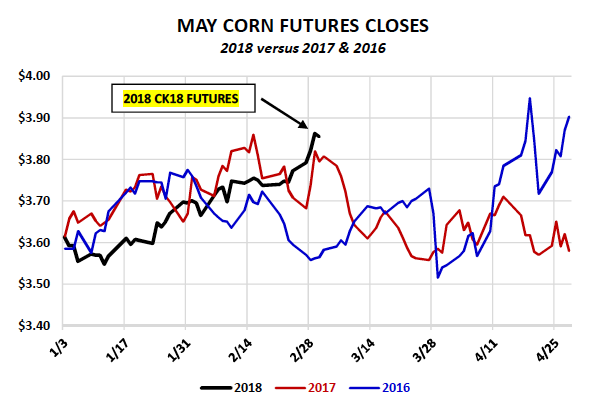
Can we assume that the price action in March corn futures in 2018 will act similar to 2017? From a fundamental perspective in last year’s March 2017 WASDE report 2016/17 U.S. corn ending stocks were estimated at 2.320 billion bushels. World corn stocks were forecasted at 220.7 MMT. As of the February 2018 WASDE report 2017/18 U.S. corn ending stocks were estimated at 2.352 billion bushels with World corn stocks of 203.1 MMT. All those figures are close enough in my opinion to assume a similar fundamental price response. Add to this May corn futures RSI, Relative Strength Index, reaching 73.2 on Friday (indicating “overbought” market conditions) and I continue to believe a downward correction is approaching. Money managers will likely have to defend their market length to prevent a sell-off early this week.
Twitter: @MarcusLudtke
Author hedges corn futures and may have a position at the time of publication. Any opinions expressed herein are solely those of the author, and do not in any way represent the views or opinions of any other person or entity.
Data References:
- USDA United States Department of Ag
- EIA Energy Information Association
- NASS National Agricultural Statistics Service


