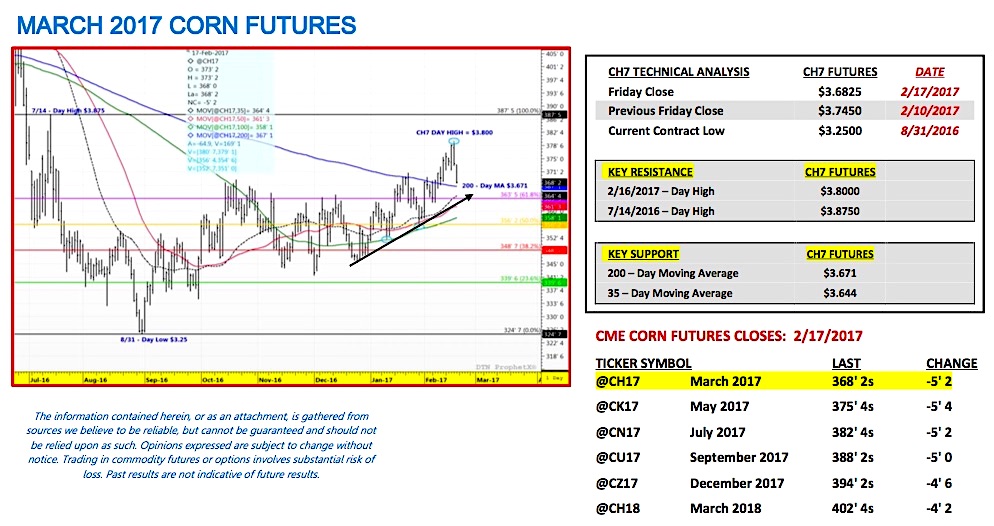
March corn futures moved lower this week, closing down 7 ¼-cents per bushel week-on-week, finishing on Friday (2/17) at $3.68 ¼.
After trading up to a day high and 7-month high of $3.80 per bushel early in Thursday’s session, CH7 abruptly rolled over going into Thursday’s close. That selling carried over into Friday, resulting in a lower weekly close for Corn (NYSEARCA:CORN).
WEEKLY MARKET HIGHLIGHTS (2/13 – 2/17):
Mexico – U.S. Trade Relations On Monday (2/13) CNN reported on the current deteriorating state of Mexico – U.S. trade relations (Trump implying a tariff could be used on Mexican imports to pay for “the wall”), specifically pointing to the possibility of Mexico now retaliating by shifting its current U.S. corn imports to Brazil and/or Argentina. Mexican Senator, Armando Rios Piter, suggested that sending a bill that effectively shut out U.S. corn from Mexico’s market was a realistic consideration. It should be noted that from 2013/14 through 2016/17 Mexico’s total corn imports averaged 12.5 MMT per crop year. Overall, Mexico is the World’s 2nd largest corn importer (trailing only Japan).
How vital is Mexico to U.S. corn producers? Over the last 5-years (2011/12 – 2015/16) Mexico has represented on average approximately 25% of the U.S. corn export market share (low-to-high range of 22.4% to 28.2%). Therefore for the 2016/17-marketing year (ends August 31st, 2017), Mexico could theoretically account for U.S. corn export sales of over 500 million bushels (the USDA’s February 2017 U.S. corn export forecast was 2,225 million bushels). That said Mexico is clearly a very significant demand center for U.S. corn and one that can’t be easily replaced.
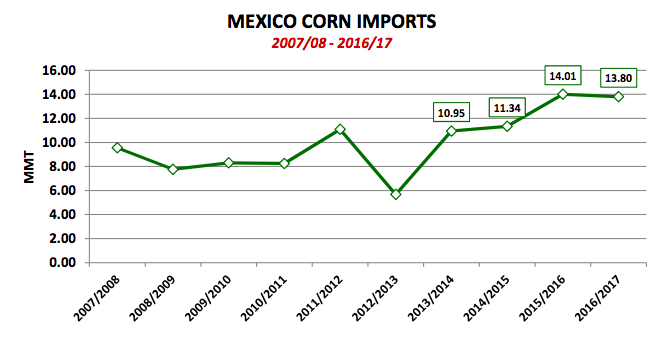
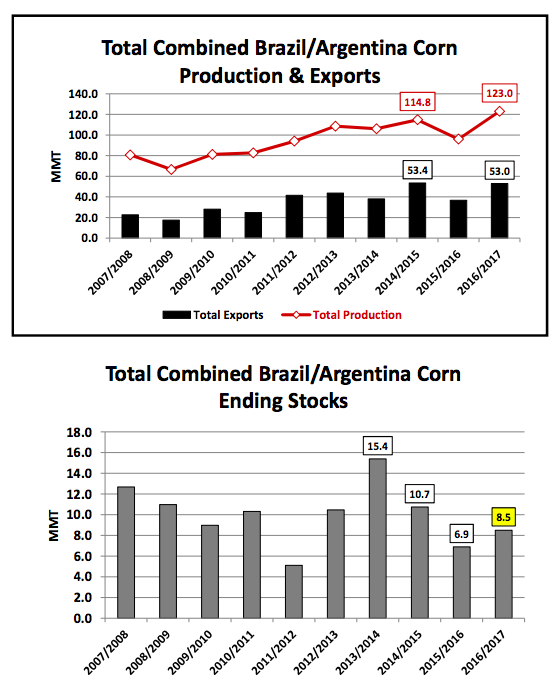
Are Brazil and Argentina capable of displacing U.S. corn imports? For 2016/17 the answer is probably yes BUT only to a limited percentage (not nearly 100%). Combined 2016/17 corn production for Brazil and Argentina is currently estimated at a record high of 123 MMT, eclipsing the previous high-water mark of 114.8 MMT from 2014/15. Additionally, combined 2016/17 corn exports for Brazil and Argentina are already forecasted at 53 MMT, the 2nd highest ever. HOWEVER the key figure for both countries is projected 2016/17 ending stocks. Argentina’s 2016/17 corn carryout is estimated at just 2.06 MMT with Brazil’s corn carryout forecasted at 6.44 MMT. Therefore the math says that combined 2016/17 corn ending stocks of 8.5 MMT (or 335 million bushels) for Brazil/Argentina aren’t nearly enough to offset Mexico’s projected 2016/17 total corn import forecast of 13.8 MMT (or 543 million bushels), most of which has historically been sourced from the U.S. Point being Mexico’s likely not in a position to eliminate U.S corn imports altogether in 2017. Argentina and Brazil simply don’t have enough surplus corn stocks to further increase their current export profile during the 2016/17-marketing year.
U.S. ETHANOL STOCKS RISE AGAIN Wednesday’s (2/15) EIA report showed U.S. ethanol stocks climbing for the 6th consecutive week to 22.5 million barrels as of the week ending 2/10/2017. Since December 30th, 2016, U.S. ethanol stocks have risen 3.82 million barrels (up 20.5%). Current stocks are the highest the U.S. market has experienced since March 23rd, 2016 (23.022 million barrels). As far as production was concerned, weekly U.S. ethanol production averaged 1.040 million barrels per day versus 1.055 million bpd last week and the 4-week average of 1.052 million bpd. U.S. gasoline demand continues to disappoint with the 4-week average down 5.3% versus 2016 (8.431 million bpd versus 8.902 million bpd).
WEEKLY EXPORT SALES SUMMARY Thursday’s (2/16) U.S. Export Sales report showed 2016/17 U.S. corn export sales of 30.8 million bushels for the week ending 2/9/2017. Mexico was a small weekly buyer of approximately 2.7 million bushels. Overall…marketing year-to-date U.S. corn export sales improved to 1,652.4 million bushels versus 1,011.0 the previous year (+63%). Also of note, earlier in the week U.S. corn export inspections (physical shipments) of 49.4 million bushels were reported, which was above the pace necessary to achieve the USDA’s current 2016/17 U.S. corn export sales forecast of 2,225 million bushels.
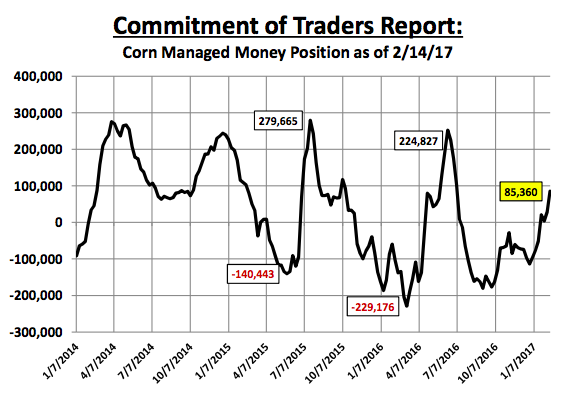
MANAGED MONEY LONG IN CORN INCREASES SHARPLY Friday’s (2/17) Commitment of Traders report showed a massive increase in the Managed Money long in corn. Money managers were net buyers of 56,527 corn contracts week-on-week, expanding their long position to +85,360 contracts as of the market close on 2/14/2017. By comparison a year ago, as of the market close on 2/16/2016, money managers were carrying a net SHORT position in corn totaling -137,937 contracts. One would naturally assume this year’s U.S. and World corn S&D tables were largely responsible for encouraging the significant shift in money flow relative to 2016. However as I mentioned in last week’s column, both U.S. and World corn ending stocks are currently substantially higher this February versus February 2016. More specifically, current U.S corn ending stocks (2016/17) are now 483 million bushels higher than the USDA’s February 2015/16 forecast; meanwhile current World corn ending stocks (2016/17) are 344 million bushels higher than the USDA’s February 2015/16 forecast. Therefore the money shift doesn’t appear to be fundamentally supported.
KEY CH7 PRICING CONSIDERATIONS FOR THE WEEK ENDING 2/17/2017: March corn futures (CH7) closed on Friday (2/17) at $3.68 ¼ finishing down 7 ¼-cents per bushel week-on-week.
Key takeaways from this week’s price action:
- For Corn Bulls Thursday’s price action was not good. Early in the session March corn futures spiked higher, advancing to a new 7-month high at $3.80 per bushel; however there wasn’t nearly enough follow through buying to maintain the upward momentum into the close. That afternoon CH7 closed down 5 ¼-cents per bushel. Thursday’s sell paper then spilled into Friday’s market, which in turn resulted in March corn futures closing down 5 ¼-cents per bushel for the 2nd consecutive session, closing at $3.68 ¼.
- Technically March corn is now getting very close to penetrating key price support at the 200-Day Moving Average of $3.671 (followed closely by the 35-Day Moving Average at $3.644). That said the recent “rally” now appears in danger of rolling over. This comes despite CH7 trading from a day low of $3.58 on February 1st up to a day high of $3.80 on February 16th, a 22-cent rally that in retrospect has already given back more than 50% of its total price advancement in just 1 ½-trading sessions.
- What don’t I like as a Corn Bull: The 22-cent rally in February was fueled in large part by a Managed Money long in corn increasing from just +3,461 contracts on 1/31/17 to +85,460 contracts on 2/14/2017. Therefore nearly 82,000 contracts in net long corn deltas generated LESS THAN a 25-cent rally in corn. That’s not something Corn Bulls will want to advertise; however it speaks to the larger issue of sustaining major corn rallies longer-term (this spring and summer). The reality is there is a MASSIVE farmer cash long in the market that is waiting to sell corn every time the “money” creates even minor 10 to 20-cent up moves in the market. This commercial hedge/sell paper is more than offsetting Managed Money corn buying.
This is a problem…without a legitimate Bullish fundamental story in corn (which we don’t have right now); sustaining corn rallies above key price resistance will likely remain difficult. Thanks for reading.
Twitter: @MarcusLudtke
Author hedges corn futures and may have a position at the time of publication. Any opinions expressed herein are solely those of the author, and do not in any way represent the views or opinions of any other person or entity.
Data References:
- USDA United States Department of Ag
- EIA Energy Information Association
- NASS National Agricultural Statistics Service


