SEPTEMBER corn futures closed UP 7 ¾-CENTS per bushel week-on-week, finishing at $3.62 ¾.
Let’s review current themes and trends for the week ahead (week of August 6):
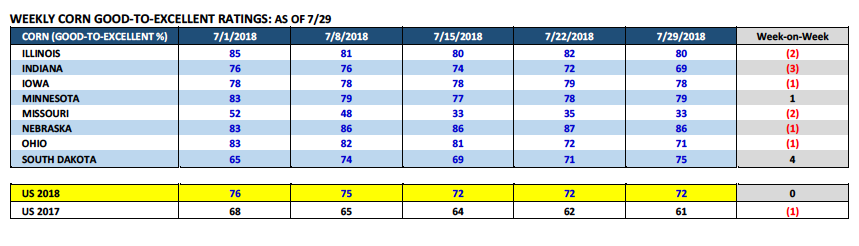
Monday’s Weekly Crop Progress report showed the U.S. corn good-to-excellent rating UNCHANGED week-on-week at 72%.
There were however weekly declines in several key corn production states. Illinois’s good-to-excellent rating fell 2% to 80%. Indiana’s rating was off 3%, dropping to 69%. Meanwhile Iowa and Nebraska each saw their good-to-excellent ratings dip 1% to 78% and 86% respectively.
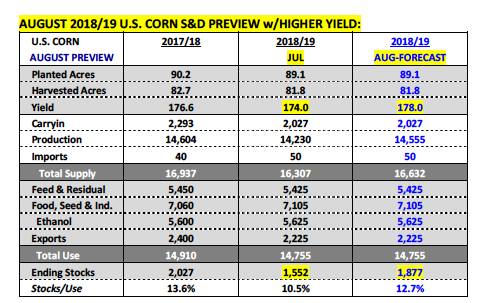
Despite those minor reductions, I don’t think it’s changed the view from private analysts who still expect the USDA to raise its 2018/19 U.S. corn yield estimate 2 to 4 bpa in the August 2018 WASDE report (released on August 10th).
I went back this week to compare the good-to-excellent ratings (2017 versus 2018) of some the U.S.’s top corn producers as of the end of July.
As you can see below, other than Minnesota and Missouri, the vast majority of the U.S.’s largest corn producers are enjoying double digit increases in their good-to-excellent ratings versus a year ago. Now does that mean I’m suggesting the final 2018 yields in states such as Iowa and Illinois will repeat their record to near-record yields from 2017, simply due to a year-on-year ratings bump? Not necessarily… as we all learned a year ago, crop ratings are extremely subjective and there isn’t always a tangible yield correlation.
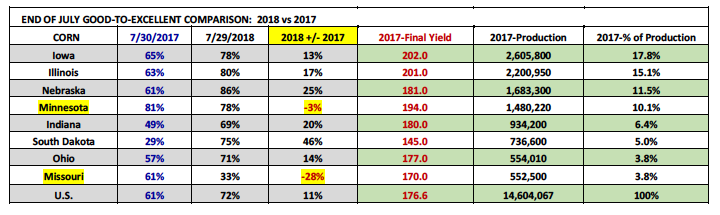
That said I think it’s fairly safe to say that when looking at the top 5 U.S. corn producers (Iowa, Illinois, Nebraska, Minnesota, and Indiana), all should come very close to approaching their corn yields from 2017 at a minimum. The exception might be Minnesota, where due to several drowned-out spots in various sections of the state, yields might be off 3 to 5% from last year’s record state yield of 194 bpa. However, that still puts MN’s 2018 yield in the 184 to 188 bpa ranges, which is exceptional.
On Wednesday, FC Stone released its August 2018 U.S. corn and soybean yield estimates. They pegged the U.S. corn yield at 178.1 bpa (versus the USDA’s July forecast of 174.0 bpa) for total production of 14.562 billion bushels (versus the USDA’s July forecast of 14.230 billion bushels). That type of production increase with no changes to demand would push U.S. corn ending stocks up to 1.884 billion bushels, 325 million bushels higher than a month ago.
In soybeans, FC Stone issued a U.S. soybean yield projection of 51.5 bpa (versus the USDA’s July forecast of 48.5 bpa) for total production of 4.574 billion bushels (versus the USDA’s July forecast of 4.310 billion bushels). A 264 million bushel increase in production with no adjustments to demand would move U.S. soybean ending stocks up to 844 million bushels!
Of the two yield forecasts, I’m more inclined to believe a 4 bpa increase to the U.S. corn yield as probably versus a 3 bpa increase to the soybean yield.
The USDA will do everything it can to keep 2018/19 U.S. soybean ending stocks from ballooning over 700 million bushels. A U.S. soybean carryout in excess of 700 or 800 million bushels would likely send soybean futures spiraling back downward toward their recent contract lows (SU18 contract low = $8.16 ½; established on 7/16/18). A move below $8.00 would even be possible in my opinion.
With China still in Trump’s crosshairs (on Wednesday Trump threatened to raise tariffs on Chinese imports of $200 billion to 25% versus 10%), I don’t see a quick resolution to the U.S. soybean export conundrum. That said I can’t find a demand offset to increasing U.S. soybean production prospects. This will invariably keep a lid on any sizable recovery attempts in soybean prices for the foreseeable future. HOWEVER near-term…I fully expect the USDA to do everything it can including slowly increasing the U.S. soybean yield in the August WASDE report (possibly +0.5 to +1 bpa versus +3 bpa), which allows them to postpone having to publish a carryout figure above +700 million bushels as long as possible.
September Corn Futures TRADING OUTLOOK
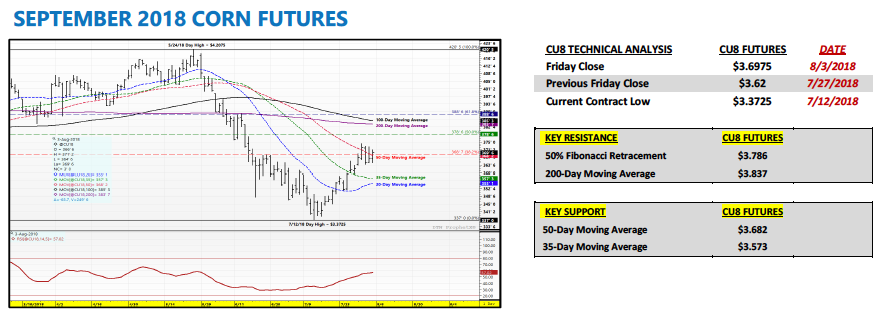
Corn futures achieved their 3rd consecutive HIGHER weekly close. More importantly… CU18 managed to punch back over the 50-day moving average at $3.68 ¼ Friday afternoon. That’s a strong finish to the week and a critical area to sustain a close above. This should bring in more buying next Monday (8/6) assuming traders wait to pre-position for the August 2018 WASDE report until Wednesday or Thursday.
The latest Commitment of Traders report showed Money Managers still net short -52,198 contracts; therefore the close over the 50-day should trigger more buy-backs of short positions. That said the question is can corn keep moving higher later in the week with most traders expecting a yield increase next Friday of 2 to 4 bpa? A 4 bpa yield increase would raise 2018/18 U.S. corn ending stocks 325 million bushels versus July. For this reason I’m expecting red figures/selling pressure from whatever level CU18 is trading at next Wednesday/Thursday.
The next topside chart objectives on a higher opening Monday are the 50% Fibonacci retracement at $3.786 followed by the 200 and 100-day moving averages at $3.837 and $3.853 respectively.
Longer-term…I do get the sense that traders believe corn futures have the potential to rally back over $3.90 in September corn futures. However the biggest negative facing the corn market is still the weakness in the soybean complex. If soybean futures roll back over (due to U.S. soybean stocks possibly pushing past +650 million bushels) it’s going to be difficult for corn futures to move sharply in the other direction.
August 2018 WASDE report out next Friday at 11:00 a.m. CST. Good luck!
Twitter: @MarcusLudtke
Author hedges corn futures and may have a position at the time of publication. Any opinions expressed herein are solely those of the author, and do not in any way represent the views or opinions of any other person or entity.
Data References:
- USDA United States Department of Ag
- EIA Energy Information Association
- NASS National Agricultural Statistics Service

: Worrisome to Broader Market?")


