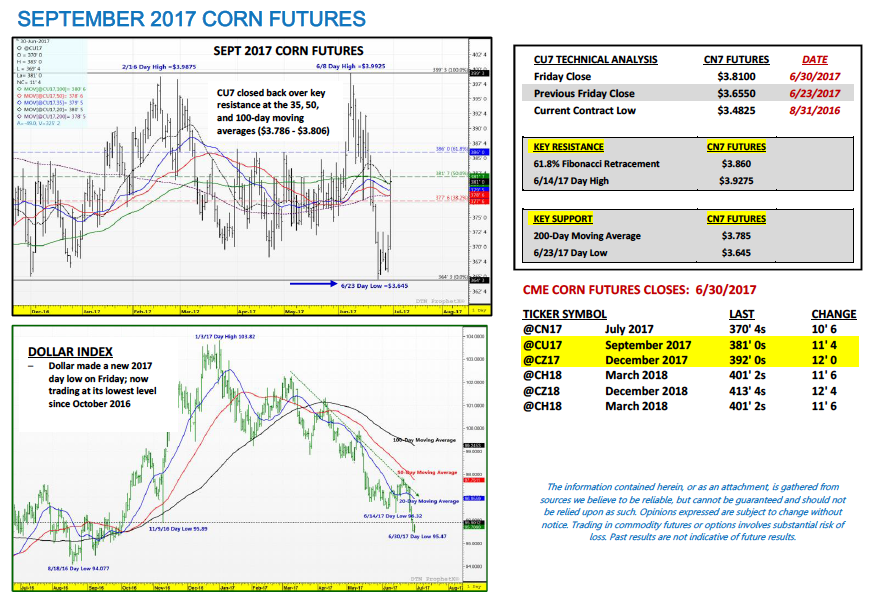
September corn futures moved sharply higher last week, closing up 15 ½-cents per bushel week-on-week, finishing the week (6/30) at $3.81.
September corn futures rallied aggressively on Friday (closing up 11 ½-cents on 6/30) despite what was largely considered a Bearish June Acreage and Stocks report for corn. Let’s dig in.
Weekly Corn Price Drivers (6/26/17 – 6/30/17)
U.S. Corn Crop Ratings: Monday’s Crop Progress report showed the U.S. corn good-to-excellent rating once again unchanged week-on-week at 67% as of the week ending June 25th compared to 75% in 2016. The trade was expecting to see a slight improvement following a week of cooler temperatures and increased precipitation across the Corn Belt; however that was not the case, at least on a national level. Both Illinois and Indiana did see their state good-to-excellent ratings improve slightly (IL +3% and IN +1% week-on-week); however those gains were largely offset by somewhat surprising ratings decreases in Minnesota and Nebraska (MN -3% and NE -4% week-on-week), which have been two of the highest-rated states statistically thus far in the 2017 growing season.
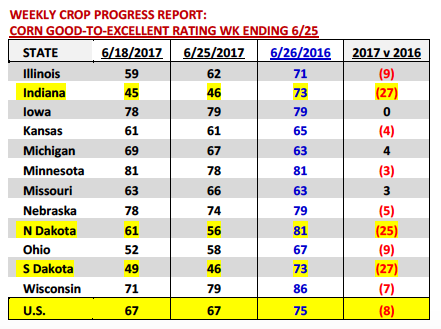
I would argue the most recent Weekly Crop Progress report was a minor victory for Corn Bulls. Despite an improved Midwest weather forecast crop condition gains were extremely limited, specifically in the Eastern Corn Belt. This would seem to indicate that problems in states such as Illinois, Indiana, and Ohio aren’t going to be resolved by simply a shift to a more “crop-friendly” summer weather pattern. Furthermore prospects for a much warmer post-4th of July, 6 to 10-day forecast coupled with below-normal precipitation in the Western Corn Belt (North Dakota, South Dakota, and Nebraska) has traders starting to lean more price positive on corn futures moving into the first week of July.
If I were to try and assess the top 3 most concerning Corn Belt states at present it would be Indiana (46% good-to-excellent; -27% versus 2016), North Dakota (56% good-to-excellent; -25% versus 2016), and South Dakota (46% good-to-excellent, – 27% versus 2016). However there are also a number of other key corn producing states that aren’t close to what they were a year ago from a crop condition standpoint. Illinois, Ohio, and Wisconsin would all likely fall into that category with Nebraska possibly being added to that list in the weeks to come based on the aforementioned 6 to 10-day forecast. Illinois, Nebraska, Indiana, and South Dakota are 4 of the top 6 corn producers in the country. Therefore the potential impact on the U.S. corn yield overall is legitimate.
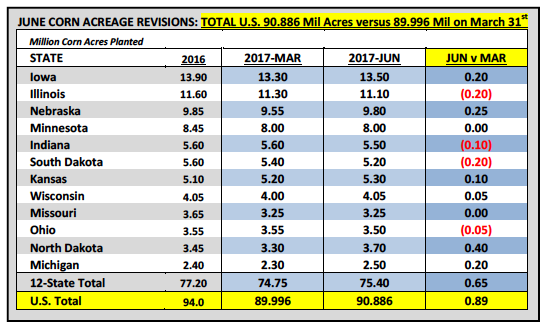
June 30th Acreage & Stocks Reports: On Friday the USDA released its much anticipated June Acreage and Stocks reports, which did contain a few notable surprises. The first being an INCREASE to the USDA’s March 31st Prospective Plantings estimate in corn. The USDA raised its 2017/18 U.S. corn acreage forecast to 90.886 million acres versus 89.996 million in March and the average trade guess of 89.903 million. Corn Bulls had been hoping for a minimum 500,000 acre reduction. Therefore the fact that planted acreage increased was a very unpopular turn of events.
That said the thread of hope for Corn Bulls moving forward is that over the last 10-crop years the USDA has lowered planted corn acreage in its “FINAL” production report on 7 different occasions (January FINAL versus June; see page 3). This would include acreage reductions in each of the past 4 consecutive crop years (2013/14 – 2016/17). The largest acreage decline (January FINAL versus June) was -2.0 million acres in 2013/14. The average acreage decrease has been -928,000 acres. Considering all of the replanted corn acres this spring in the Eastern Corn Belt I’m already expecting a lower acreage figure once again this January.
Meanwhile…June 1, 2017 corn stocks were estimated at 5.225 billion bushels versus the average trade guess of 5.123 billion bushels and June 1, 2016 corn stocks of 4.711 billion. Of that total 2.841 billion bushels were projected to be “On Farm” compared to 2.471 billion bushels in 2016 (+370 million bushels).
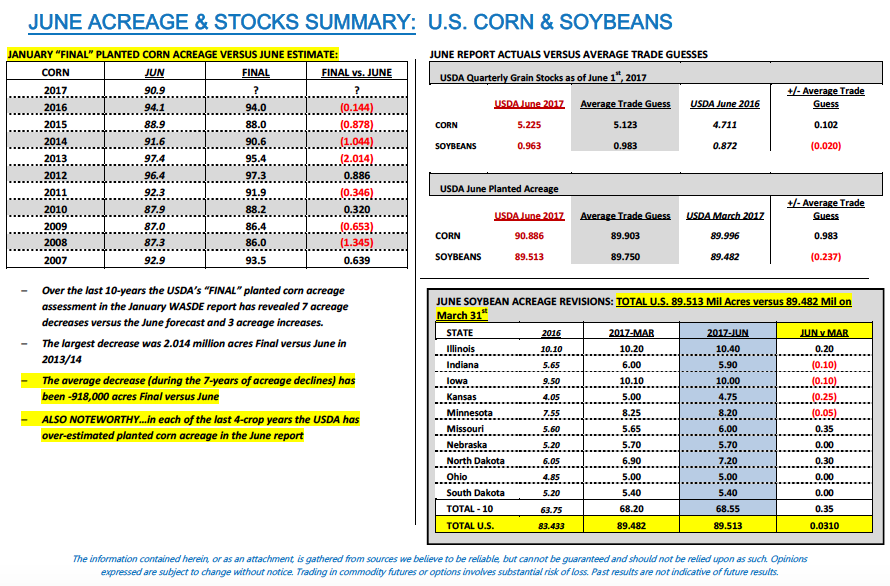
As far as soybeans were concerned, total U.S. planted soybean acreage was revised to 89.513 million acres versus the March 31st Prospective Plantings forecast of 89.482 million. The average trade guess for the report was 89.75 million. Additionally June 1, 2017 soybean stocks were estimated at 0.963 billion bushels versus the average trade guess of 0.983 billion bushels and June 1, 2016 soybean stocks of 0.872 billion bushels.
Key Pricing Considerations For The Week Ahead:
Corn closed sharply higher on Friday despite “bearish” June corn acreage estimate & larger than expected June 1 corn stocks.
How can we account for Friday’s 11 ½-cents per bushel higher close in September corn futures following the USDA’s aforementioned increase to planted corn acreage and larger than expected June 1 corn stocks estimate? It really comes down to 2 key factors…
- After the June Acreage and Stocks reports were released at 11:00 CST on Friday (6/30), soybean futures rallied immediately. The acreage and stocks figures in soybeans were met with the complete opposite market reaction relative to corn futures. Soybean Bulls were ecstatic to see not only a planted acreage forecast less than 90 million acres (which was feared prior to the report’s release) but an estimate that actually fell below the average trade guess of 89.75 million acres. This along with a June 1 soybean stocks figure also lower than expected resulted in two major victories for Soybean Bulls. The upward price response in soybeans was further exacerbated by November soybeans just having made a new 10-month day low on June 23rd (meaning soybeans were oversold going into the June Acreage and Stocks report based on the assumption that it would be viewed as Bearish). Therefore the net result was a 30-cent higher close in November soybeans, which in turn worked to pull the corn complex higher. I firmly believe that without the aggressive rally in soybeans on Friday, corn would have closed lower on the day.
- The first summer “RIDGE” talk has officially begun. That word is synonymous with “drought” when it comes to assessing the potential yield impact on corn and soybean crops. When traders went home Friday afternoon all notable weather models were showing signs of hot and dry conditions taking up residence over large sections of the Western Corn Belt including North Dakota, South Dakota, and Nebraska. Both of NOAA’s 6 to 10-day and 8 to 14-day models also suggested the above-normal temperatures coupled with below-normal precipitation could also push into the western halves of Minnesota and Iowa. Clearly traders took note. IF this pattern is confirmed once again on Monday morning (7/3) I would expect both corn and soybean futures to add to Friday’s gains early next week.
Thanks for reading.
Twitter: @MarcusLudtke
Author hedges corn futures and may have a position at the time of publication. Any opinions expressed herein are solely those of the author, and do not in any way represent the views or opinions of any other person or entity.
Data References:
- USDA United States Department of Ag
- EIA Energy Information Association
- NASS National Agricultural Statistics Service


