JULY corn futures closed DOWN 9 ¾ -CENTS per bushel week-on-week, finishing at $3.96 ½.
The much anticipated May 2018 WASDE report, which contained the USDA’s first official 2018/19 U.S. corn and soybean balance sheets, was released on Thursday, May 10th.
The highlights from that report were as follows:
1. 2018/19 U.S. corn ending stocks were estimated at 1.682 billion bushels. This compares to the average trade guess of 1.631 billion bushels and 2017/18 ending stocks of 2.182 billion bushels. How Bullish is the USDA’s 2018/19 U.S. corn ending stocks forecast? I would argue with December 2018 corn futures trading at approximately $4.20, the USDA’s May carryout figure was already largely priced into CZ18 futures. If anything however it does create a firm undertone to the market and validates the need for a 2018/19 U.S. corn yield at or slightly above-trend to maintain sufficient stocks levels.
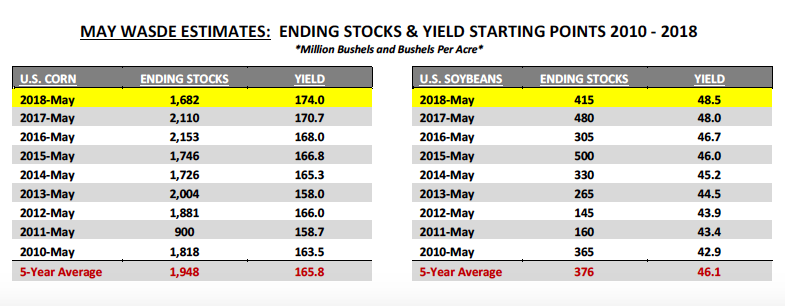
I should add that the USDA’s 2018/19 U.S. corn carryout estimate is the lowest initial May stocks forecast since 2011 (see below). Additionally to generate that carryout the USDA plugged a “trend-line” U.S. corn yield of 174 bpa, which if realized would be the 3rd highest U.S. corn yield on record. Point being that type of yield is far from guaranteed. Therefore I fully expect even minor corrections in December corn futures to be well supported until more is known about the presumed size (acreage) and quality (yield) of this year’s U.S. corn crop. Those questions will persist into mid-June at a minimum.
2. 2018/19 U.S. soybeans ending stocks were estimated at 415 million bushels. This compares to the average trade guess of 549 million bushels and 2017/18 ending stocks of 530 million bushels. How Bullish is the USDA’s 2018/19 U.S. soybeans ending stocks forecast? With November 2018 soybean futures trading well below its contract high of $10.60 from April 2nd, 2018, the USDA’s carryout estimate feels somewhat friendly at current price levels. However upon further review of the USDA’s actual demand estimates by sector I learned the primary reason the USDA’s ending stocks projection fell nearly 135 million bushels BELOW the average trade guess was due to a very optimistic forecast for 2018/19 U.S. soybean exports. The USDA estimated 2018/19 U.S. soybean exports of 2.290 billion bushels versus 2.065 billion in 2017/18.
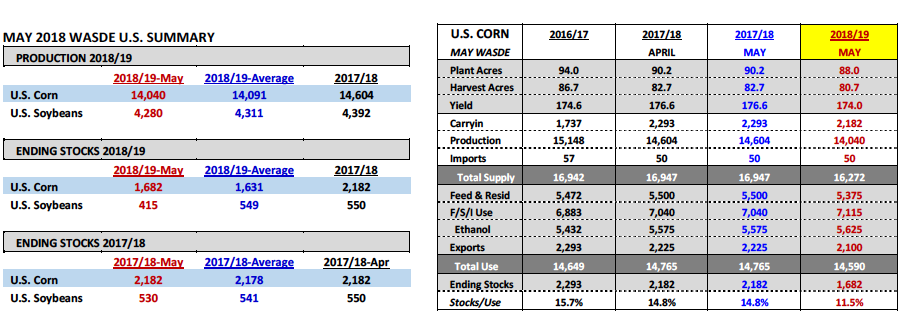
From my perspective it’s hard to justify what would be record U.S. soybean exports in 2018/19 with China currently threatening a 25% tariff on U.S. soybean imports; knowing China represents approximately half of all U.S. soybean export sales. Furthermore in the May report the USDA also raised 2017/18 Brazil soybean production to a record high 117 MMT and 2017/18 Brazil soybean exports to 73.3 MMT (versus U.S. soybean exports of 56.2 MMT). With Brazil’s 2017/18 soybean ending stocks estimated at 22.87 MMT (840 million bushels), clearly they have the ability to export even more soybeans if the world market (specifically China) incentivizes them to do so. Additionally Brazil’s 2018/19 soybean production, exports, and ending stocks figures were all forecasted to be similar to 2017/18.
That said if the USDA’s current 2018/19 U.S. soybean export estimate proves to be too high by 100 to 150 million bushels, 2018/19 U.S. soybean ending stocks would immediately jump right back over 500 million bushels. That doesn’t support $10.50 November 2018 soybean futures long-term…
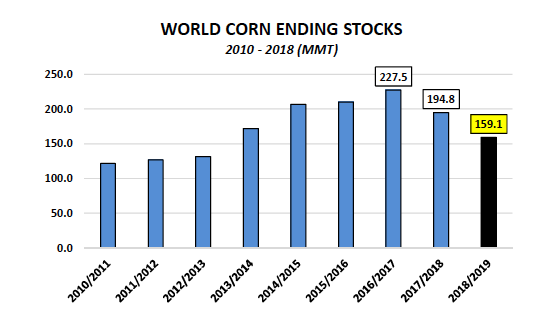
3. And finally…the World corn Supply & Demand figures provided few surprises with 2017/18 Brazil corn production lowered to 87 MMT versus 92 MMT in April and 98.5 MMT in 2016/17. 2017/18 Argentina corn production was unchanged at 33.0 MMT versus 41.0 MMT in 2016/17. Both numbers were largely in the market prior to them being reported on Thursday. The one sizable adjustment however was lower 2018/19 World corn ending stocks, which were estimated at 159.15 MMT, down 35.7 MMT or -18% from 2017/18. The decrease was largely attributed to lower carryin stocks. We’ll have to see what impact if any that reduction has on corn futures prices both short and long-term.
JULY 2018 CORN FUTURES PRICE FORECAST:
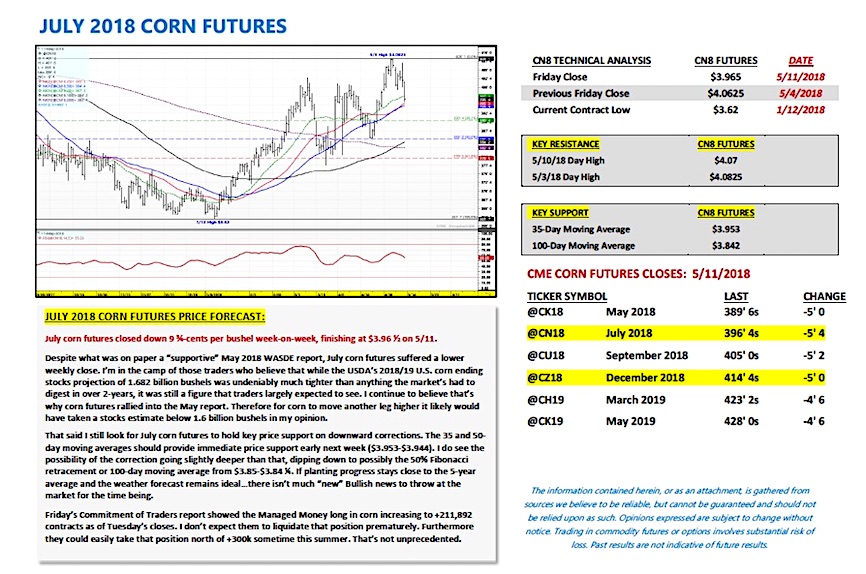
July corn futures closed down 9 ¾-cents per bushel week-on-week, finishing at $3.96 ½ on 5/11.
Despite what was on paper a “supportive” May 2018 WASDE report, July corn futures suffered a lower weekly close. I’m in the camp of those traders who believe that while the USDA’s 2018/19 U.S. corn ending stocks projection of 1.682 billion bushels was undeniably much tighter than anything the market’s had to digest in over 2-years, it was still a figure that traders largely expected to see. I continue to believe that’s why corn futures rallied into the May report. Therefore for corn to move another leg higher it likely would have taken a stocks estimate below 1.6 billion bushels in my opinion.
That said I still look for July corn futures to hold key price support on downward corrections. The 35 and 50-day moving averages should provide immediate price support early next week ($3.953-$3.944). I do see the possibility of the correction going slightly deeper than that, dipping down to possibly the 50% Fibonacci retracement or 100-day moving average from $3.85-$3.84 ¼. If planting progress stays close to the 5-year average and the weather forecast remains ideal…there isn’t much “new” Bullish news to throw at the market for the time being.
Friday’s Commitment of Traders report showed the Managed Money long in corn increasing to +211,892 contracts as of Tuesday’s closes. I don’t expect them to liquidate that position prematurely. Furthermore they could easily take that position north of +300k sometime this summer. That’s not unprecedented.
Twitter: @MarcusLudtke
Author hedges corn futures and may have a position at the time of publication. Any opinions expressed herein are solely those of the author, and do not in any way represent the views or opinions of any other person or entity.
Data References:
- USDA United States Department of Ag
- EIA Energy Information Association
- NASS National Agricultural Statistics Service

 Flirting With Critical Support… Again")


