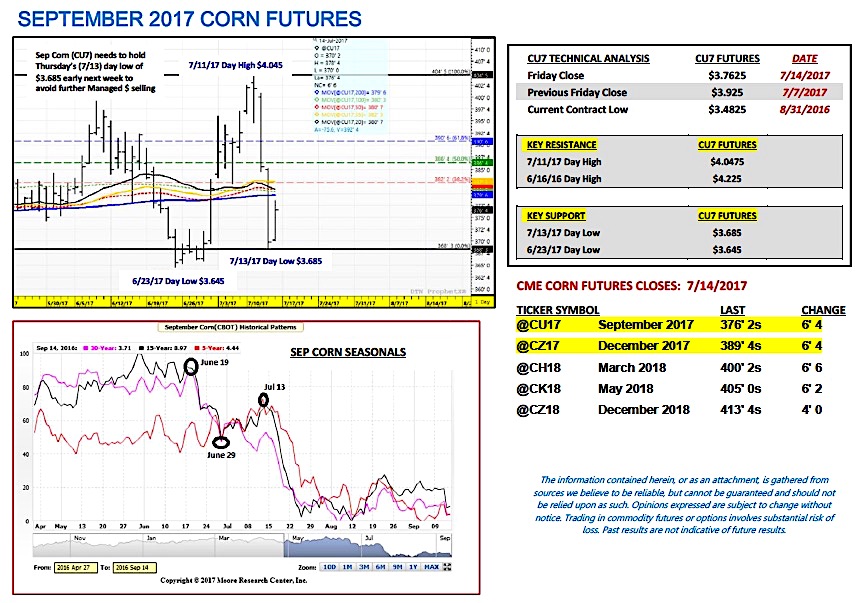
September corn futures moved sharply lower this week, closing down 16 ¼-cents per bushel week-on-week, finishing on Friday (7/14) at $3.76 ¼.
September corn futures collapsed on Wednesday and Thursday following a combination of equally price negative market forces including a Bearish July 2017 WASDE report, as well as, a slightly less threatening extended weather forecast.
WEEKLY CORN PRICE DRIVERS
U.S. Corn Crop Ratings: Monday’s Crop Progress report showed the U.S. corn good to-excellent rating falling 3% week-on-week to 65% versus 68% last week and 76% last year. The trade was expecting a 2 to 3% decline. The most notable state decrease was a 7% cut to Nebraska’s good-to-excellent rating, which fell to 68% versus 80% in 2016. Nebraska is the 3rd largest state corn producer in the country. The other four largest producers are currently rated as follows: Iowa 77% good-to-excellent versus 79% in 2016; Illinois 63% good-to-excellent versus 76% in 2016, Minnesota 80% good-to-excellent versus 81% in 2016, and Indiana 48% good-to-excellent versus 74% in 2016. Those five states account for 53% of total U.S. planted corn acreage in 2017 (47.9 million acres).
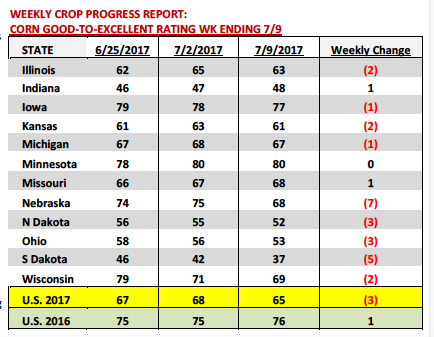
I remain of the opinion that current crop condition ratings support a U.S. corn yield in the 165 to 168 bpa ranges. The best corn can be found in northern IA and Minnesota. The areas of most concern are still the Dakota’s, Nebraska, as well as, sections of Illinois and Indiana. Based on NOAA’s extended weather models (both the 6 to 10-day and 8 to 14-day forecasts) the majority of crop analysts are still coming to the conclusion that U.S. corn condition ratings are more than likely going to continue inching lower versus stabilizing or moving higher over the next two weeks. That said I’m not expecting a sharp reduction in ratings.
July 2017 WASDE Report Summary: On Wednesday the USDA released its July 2017 WASDE report, which had undeniably Bearish pricing consequences for corn futures in particular. 2017/18 U.S. corn ending stocks were estimated at 2.325 billion bushels versus the average trade guess of 2.181 billion and June ending stocks of 2.110 billion. The USDA chose to leave the U.S. corn yield unchanged at 170.7 bushels per acre versus the average trade guess of 169.6 bpa. Corn Bulls will now quickly attempt to pivot the market conversation to a likely 2 to 3 bpa U.S. corn yield decrease coming in the August WASDE report, which will be released on 8/10/17.
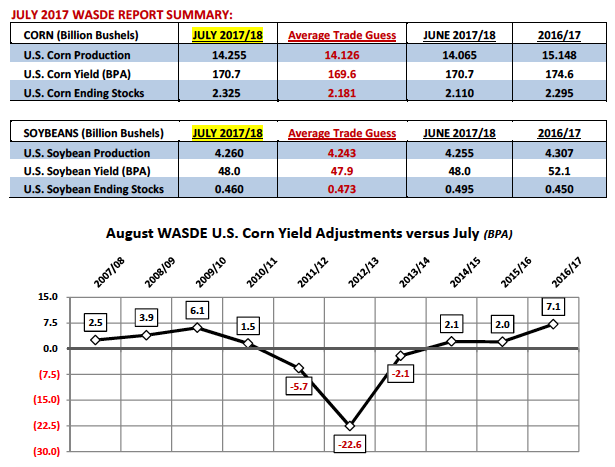
Over the last 10-years the USDA has increased the U.S. corn yield 7 times in the August report versus 3 decreases. The average yield decrease (not including the outlier year of 2012) has been -3.9 bpa.
What would a -3.9 bpa yield decrease do to the 2017/18 U.S. corn balance sheet? Assuming the rest of the U.S. corn S&D profile remained unchanged a 166.8 bpa yield (-3.9 bpa versus the current yield forecast of 170.7 bpa) would lower total U.S. corn production to 13,930 million bushels. The production differential would in theory create a 325 million bushel cut to U.S. corn ending stocks resulting in a 2017/18 corn carryout of 2.0 billion bushels. Therein lies the problem for Corn Bulls…unless traders can be convinced that this year’s U.S. corn crop is headed for a final yield below 165 bpa U.S. corn ending stocks are likely to remain more than adequate.
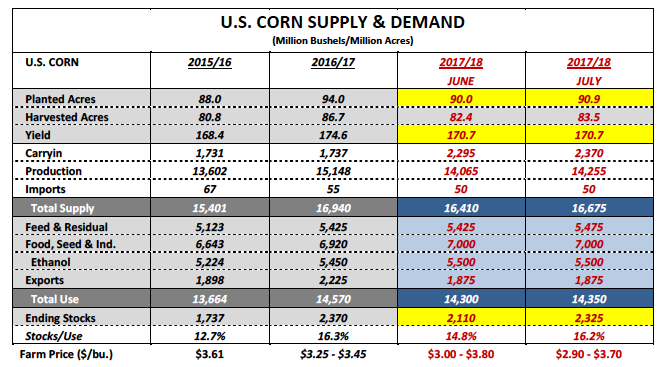
The other negative in the report was a 6.5 MMT increase to 2017/18 World corn stocks versus a month ago. Brazil’s 2016/17 corn production forecast was left unchanged at a record 97 MMT with a large percentage of those bushels now starting to displace U.S. corn in various world export channels. Weekly U.S. corn export sales were essentially non-existent with old-crop sales totally just 6.3 million bushels.
Key Price Considerations For September Corn Futures (CU7):
Weather Market’s Giveth and Taketh Away…
Stop me if you’ve heard this song before…July summer corn rally undone by a Bearish July 2017 WASDE report (in which the USDA didn’t lower the U.S. corn yield despite suggestions all is not well in every corner of the U.S. Corn Belt) followed shortly by unexpected pop-up showers in some of the driest sections of the Corn Belt. Such is the plight of the U.S corn producer once again in 2017. The challenges for re-igniting the most recent rally in September corn futures moving forward are now as follows:
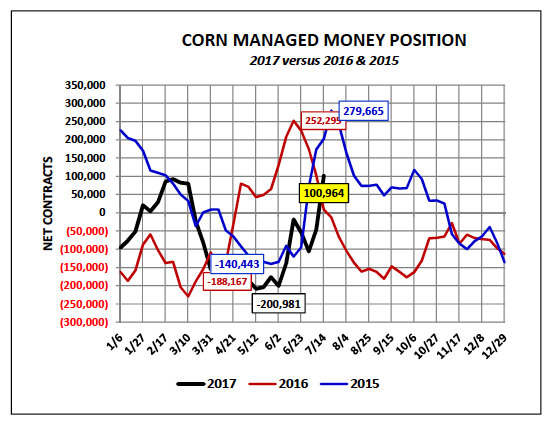
– The Managed Money long in corn had shifted to a net long of nearly +101k contracts as of the market close on Tuesday, 7/11. Therefore the “money” had flipped long only to then witness a 36-cents per bushel (high-to-low) downward pricing correction from 7/11 (day high of $4.04 ½) to 7/13 (day low of $3.68 ½). That doesn’t exactly offer any strong reassurances of risking even additional market length moving forward into what is already known to be a very negative pricing seasonal in the 5, 10, 15, and 30-year patterns into the second week of August.
– The reality is NOAA’s latest weather models show the “RIDGE” dissipating in the Western Corn Belt over time. Therefore the yield risk to the western halves of Minnesota and Iowa in particular now appear much less of a concern moving forward. Pollination fears have largely subsided in general (outside of the Dakota’s and Nebraska). That said this of course could change quickly if the weather turns hot and dry yet again; however ultimately Corn Bulls now need to prove that this year’s U.S. corn yield is headed south of 165 bushels per acre. With the added planted acreage and larger carryin stocks in the July WASDE report, it’s going to take a sizable yield reduction to raise alarm over 2017/18 U.S corn ending stocks.
Thanks for reading.
Twitter: @MarcusLudtke
Author hedges corn futures and may have a position at the time of publication. Any opinions expressed herein are solely those of the author, and do not in any way represent the views or opinions of any other person or entity.
Data References:
- USDA United States Department of Ag
- EIA Energy Information Association
- NASS National Agricultural Statistics Service


: Creating Bullish Divergence?")

