Last week MAY corn futures closed UP ¾-CENTS per bushel week-on-week, finishing at $3.88 ½.
It has been a rough ride lately for the corn market as volatility has picked up due to tariffs and trade war rhetoric. But the bulls are hanging in there pretty well.
Weekly Highlights and Outlook – April 9, 2018
1. It was an up and down week in the Ag complex with a variety of headlines resulting in considerable price volatility and erratic trading sessions.
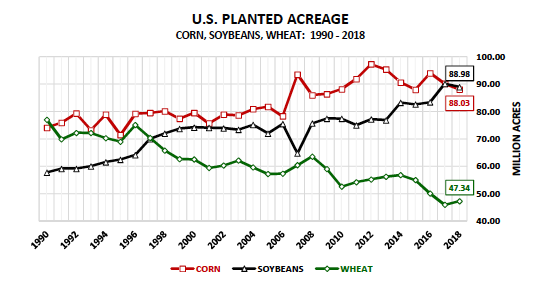
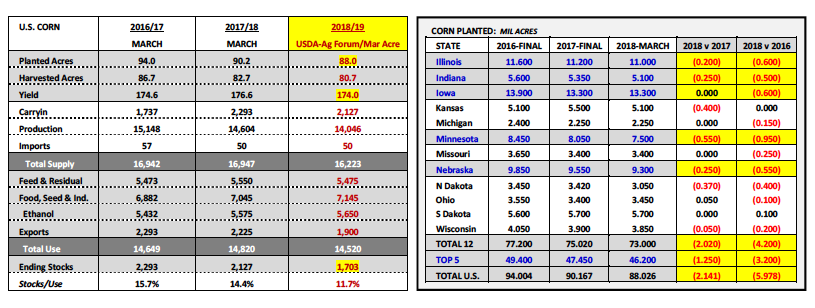
On Monday and Tuesday May corn futures probed the upper end of the current trading range, still enjoying a bullish tailwind from the USDA’s March Prospective Plantings report released on March 29th. In that report the USDA offered a much lower than expected 2018 U.S. corn planted acreage estimate totaling 88.026 million acres versus the average trade guess of 89.42 million acres and 2017 FINAL planted corn acreage of 90.167 million acres. A number of reputable private analysts were quick to respond with updated 2018/19 U.S. corn S&D’s models, which now implied U.S. corn ending stocks projections of no more than 1.7 billion bushels as probable (even after incorporating a U.S. corn yield of 174 bushels per acre; see page 2). If realized that type of U.S. corn carryout would represent a major downward adjustment from recent U.S. corn ending stocks averaging just over 2.2 billion bushels the previous 2-crop years.
2. HOWEVER on Wednesday morning prices abruptly collapsed in both corn and soybeans futures following an overnight announcement from China, which offered China’s intention to initiate retaliatory tariffs on a variety of U.S. goods and commodities.
This included a 25% tariff on U.S. soybeans. The market did not receive the news kindly considering China accounts for nearly 50% of total U.S. soybean exports (approximately 28 MMT). That said on Thursday and Friday the Bulls worked hard to par Wednesday’s losses (in both corn and soybeans) after it was learned that China’s proposed soybean tariff of 25% would not be implemented for weeks or possibly months, and only after future negotiations with the U.S.
3. The question moving forward is “Will traders focus on 2018/19 U.S. corn/soybean production potential (including the lower than expected planted acreage bases), or will the perceived threat of a Chinese tariff dissuade Corn and Soybean Bulls from adding longs at or near the recent highs?”
Corn futures in particular recovered enough on Thursday/Friday to actually close higher on the week. Soybeans futures did not. Ultimately I do believe there’s now a growing possibility that corn and soybeans prices move in different directions over the short-term. With the new-crop soybeans (SX18) / corn (CZ18) price ratio still technically favoring planting soybeans (closing at 2.50 on Friday, 4/6) and the March Prospective Plantings report insinuating the need for more corn acres, it feels like the fundamental ammunition is there to incentivize adding more corn acres via higher corn prices specifically. Furthermore with the sharply below-normal temperatures currently engulfing several key corn producing states in the Upper Midwest it’s hard to imagine a scenario where any of the top 5 U.S. corn producing states get much corn planted in April. Last year as of April 23rd Illinois’s corn crop was 34% planted, Indiana 15%, Iowa 8%, Minnesota 6%, and Nebraska 17%. Both Minnesota and Iowa were well below their 5-year averages. This year I can’t see any of those 5-states achieving last year’s planting pace as of the 23rd based on the extended weather forecast. Therefore if traders continue to trade the fundamentals (U.S. acreage, weather, and projected ending stocks)…corn futures should find willing buyers on even minor corrections. The WILD CARD remains the unpredictability of the evolving trade “war of words” for now between the U.S. and China.
MAY 2018 CORN FUTURES PRICE FORECAST:
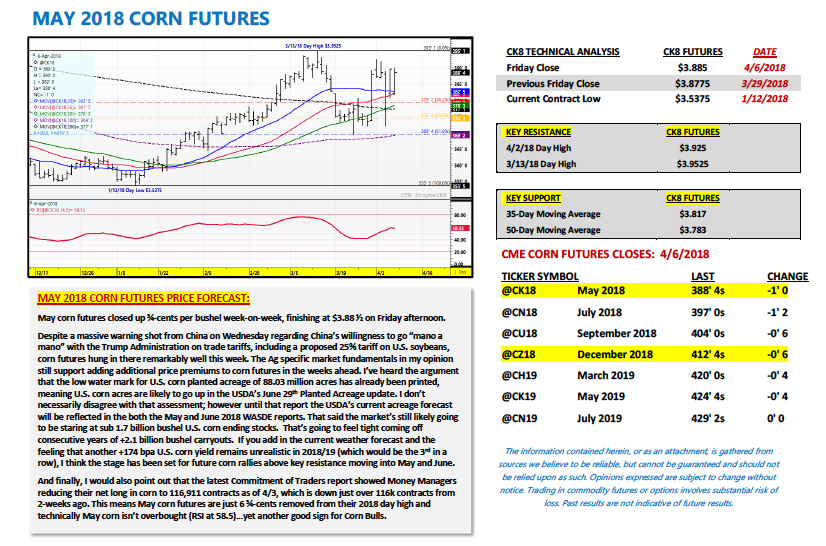
May corn futures closed up ¾-cents per bushel week-on-week, finishing at $3.88 ½ on Friday afternoon.
Despite a massive warning shot from China on Wednesday regarding China’s willingness to go “mano a mano” with the Trump Administration on trade tariffs, including a proposed 25% tariff on U.S. soybeans, corn futures hung in there remarkably well this week. The Ag specific market fundamentals in my opinion still support adding additional price premiums to corn futures in the weeks ahead. I’ve heard the argument that the low water mark for U.S. corn planted acreage of 88.03 million acres has already been printed, meaning U.S. corn acres are likely to go up in the USDA’s June 29th Planted Acreage update. I don’t necessarily disagree with that assessment; however until that report the USDA’s current acreage forecast will be reflected in the both the May and June 2018 WASDE reports. That said the market’s still likely going to be staring at sub 1.7 billion bushel U.S. corn ending stocks. That’s going to feel tight coming off consecutive years of +2.1 billion bushel carryouts. If you add in the current weather forecast and the feeling that another +174 bpa U.S. corn yield remains unrealistic in 2018/19 (which would be the 3rd in a row), I think the stage has been set for future corn rallies above key resistance moving into May and June.
And finally, I would also point out that the latest Commitment of Traders report showed Money Managers reducing their net long in corn to 116,911 contracts as of 4/3, which is down just over 116k contracts from 2-weeks ago. This means May corn futures are just 6 ¾-cents removed from their 2018 day high and technically May corn isn’t overbought (RSI at 58.5)…yet another good sign for Corn Bulls.
Twitter: @MarcusLudtke
Author hedges corn futures and may have a position at the time of publication. Any opinions expressed herein are solely those of the author, and do not in any way represent the views or opinions of any other person or entity.
Data References:
- USDA United States Department of Ag
- EIA Energy Information Association
- NASS National Agricultural Statistics Service

 Flirting With Critical Support… Again")
