December corn futures traded higher by 5 1/2 CENTS per bushel week-on-week, closing at 3.37 3/4 on Friday.
Let’s review current news, data releases, and market trends with a look to the week ahead (October 15).
On Tuesday President Trump announced a plan to allow for sale higher concentrations of ethanol (E15) in gasoline year-round. Previously the sale of E15 had largely been banned during the summer driving season.
This announcement was seen as a win for both the ethanol industry, as well as, U.S. farmers with corn representing the primary feedstock in the production of ethanol. As of the USDA’s October 2018 WASDE report, 2018/19 U.S. corn-ethanol demand was forecasted at 5.650 billion bushels, accounting for more than 37% of total U.S. corn demand.
Both ethanol producers and farmers alike cheered Trump’s push for E15; the hope being it could ignite the next buildout phase in the ethanol industry.
U.S. ethanol demand has effectively been capped at E10 for the last several years due to a variety of factors. HOWEVER the immediate market reaction to the news on Tuesday was largely disinterest(CZ closed down 2-cents per bushel that afternoon) with corn traders acknowledging that real industry expansion will require significant terminal and retail infrastructure investment (needed to distribute higher ethanol blends), as well as, a tangible economic incentive for consumers to embrace using E15.
Additionally it is believed that the refining industry will look to litigate the President’s move, which invariably will bog down any large-scale inclusion in the nation’s fuel supply over a much longer period of time. Therefore I’m of the opinion that Trump’s announcement will have little or no positive impact on 2018/19 U.S. corn-ethanol demand. That said longer-term…it could lead to material increases in U.S. corn-ethanol demand in 2019/20 and beyond.
Thursday the USDA released its October 2018 WASDE report, which featured a mildly surprising and unexpected cut to the 2018/19 U.S. corn yield.
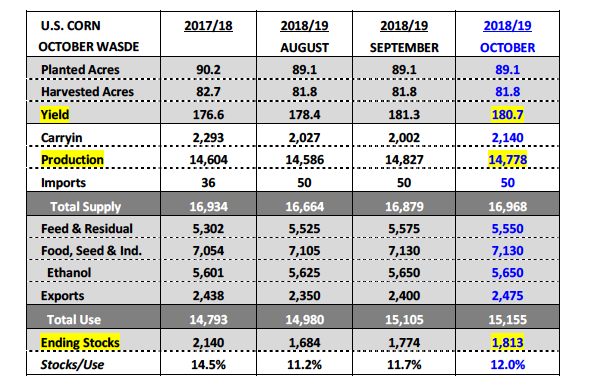
The USDA lowered the national corn yield to 180.7 bpa, down 0.6 bpa from September and 1.1 below the average trade guess of 181.8 bpa. Total U.S. corn production fell to 14.778 billion bushels versus 14.827 billion in September and the average trade guess of 14.827 billion.
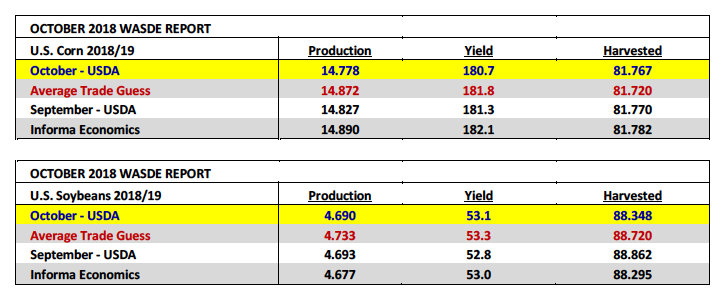
Despite the yield decline 2018/19 U.S. corn ending stocks still increased 39 million bushels month-on-month to 1.813 billion bushels.
This was primarily due to U.S. carryin stocks of 2.140 billion bushels, up 138 million bushels versus September. However even though U.S. corn ending stocks improved, the USDA’s revised stocks estimate remained substantially less than the average trade guess of 1.932 billion bushels. This was cause for celebration for Corn Bulls with the corn market rallying out of the report and closing up 6 ½-cents per bushel Thursday afternoon.
What key corn producing states saw reductions to their state yields?
Iowa saw its state corn yield fall 2 bpa versus September to 204 bpa. This however would still be a record high for Iowa. Meanwhile Illinois also experienced a similar 2 bpa yield decline with its state corn yield dropping to 212 bpa. This too would still be a record high yield for IL, exceeding its previous record of 201 bpa from 2017. Conversely Indiana and Ohio both saw their state corn yields raised 2 bpa in the October report to 194 bpa and 190 bpa respectively (both record highs).
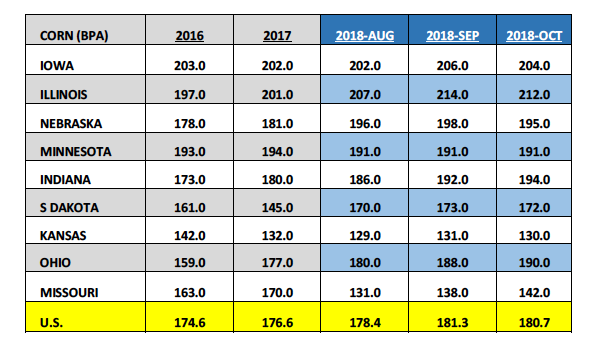
My takeaway from the USDA’s state and national corn yield adjustments: Considering 34% of the U.S. corn crop has now been harvested as of 10/7 (with 63% harvested in IL), the U.S. corn yield isn’t likely to dip much below 180 bpa moving forward; however the September estimate of 181.3 bpa will probably serve as the high-water mark for the 2018/19 crop year.
DECEMBER CORN FUTURES TRADING OUTLOOK
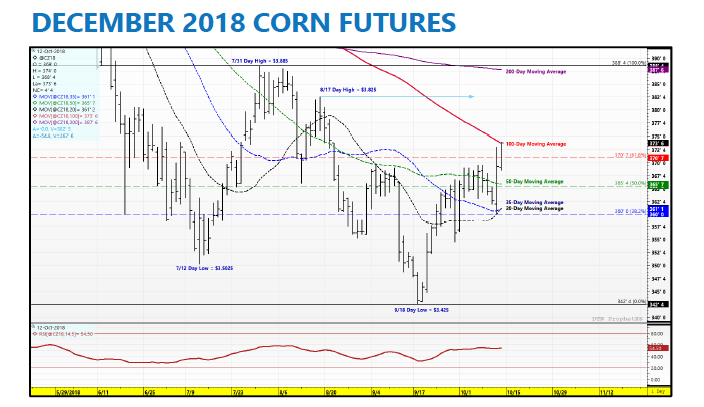
December corn futures went right up to and closed on the 100-day Moving Average of $3.736, an extremely key area of strong price resistance. In fact, CZ18 has not traded above the 100-day MA since June 6th, 2018.
The question now is: Who will be the first to add fresh longs above this level, hoping it triggers the next wave of buy paper, and therefore sustains current upward price momentum? The reality is if CZ18 fails at this level (and traders know this), it’s also entirely possible that CZ18 drifts back down to $3.61 (35-day MA) to $3.55 (key day low on 9/28/18). Therein lies the hesitation for most traders with CZ18 teetering between $3.73 and $3.74.
Ultimately however, there’s no denying Corn Bulls scored a critical fundamental victory in the October 2018 WASDE report on Thursday with the reduction to the U.S. corn yield (down -0.6 bpa versus September).
Bulls can now pivot to 3 specific analog years to further support their cause, which featured U.S. corn yield increases from August to September only to then experience a yield decline in October. In all 3 of those years the U.S. corn yield would fall again in both the November and January WASDE reports. Corn Bulls will likely use this information moving forward to insinuate the same sequence likely playing out again this year, which could lead to a final 2018/19 U.S. corn yield below 180 bpa.
Overall, if CZ18 can build on this Friday’s close early next week (and close over the 100-day MA), the next topside price target will likely be the day high on 8/17/18 of $3.82 ½ followed by the 7/31/18 day high of $3.88 ½.
A lot is riding on the early price action next Monday morning. That said I’m still selling into this move higher. The 2018/19 U.S. corn Supply and Demand in my opinion still offers a very comfortable stocks cushion… and don’t forget, most traders believe 2019 U.S. corn acreage will be up 3.5 to 4 million acres next spring. I still see this as a range bound rally.
Twitter: @MarcusLudtke
Author hedges corn futures and may have a position at the time of publication. Any opinions expressed herein are solely those of the author, and do not in any way represent the views or opinions of any other person or entity.
Data References:
- USDA United States Department of Ag
- EIA Energy Information Association
- NASS National Agricultural Statistics Service

: Worrisome to Broader Market?")


