Corn Market – Weekly Highlights
Below is a list of key happenings in the Corn market and things that traders should keep their eye on. Further below is a section dedicated to my price outlook for December Corn Futures… and why bulls need to hold $3.50 into September.
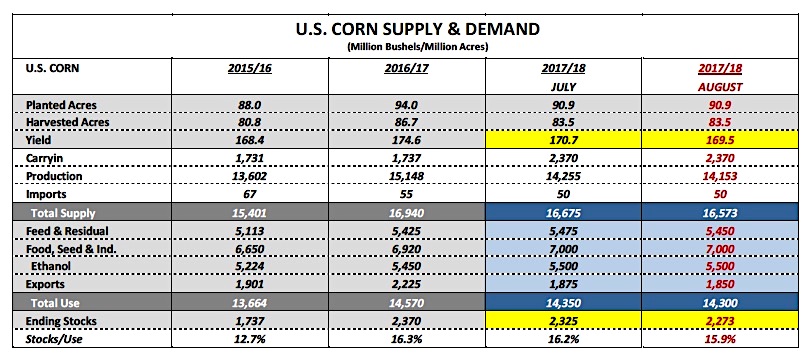
- Monday’s Weekly Crop Progress report showed the U.S. corn good-to-excellent rating improving 2% week-on-week to 62% as of 8/13/17, which felt to some (myself included) as an ultra-convenient improvement in ratings following NASS’s much-maligned August 10th U.S. corn yield estimate of 169.5 bpa. NASS’s August yield forecast exceeded the average trade guess by 3.6 bpa and left many traders scratching their heads as to NASS’s methodology considering the 2017 U.S. corn crop was at that time the worst rated crop since 2012. Even so…Monday’s revised 62% good-to-excellent rating still puts this year’s U.S. corn crop well behind 2016 (74% good-to-excellent), 2015 (74% good-to-excellent), and 2014 (72% good-to-excellent) as of mid-August. The 2013 U.S. corn crop was rated 61% good-to-excellent, which resulted in a final 2013/14 U.S. corn yield of 158.1 bushels per acre. Most of the private analysts I’m following still believe NASS has to come down on yield in the September report with current estimates ranging from 163 – 166 bpa.
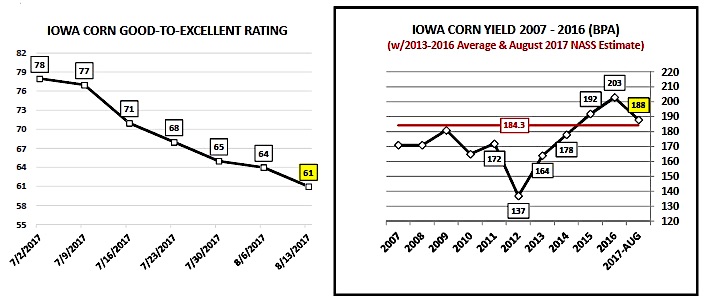
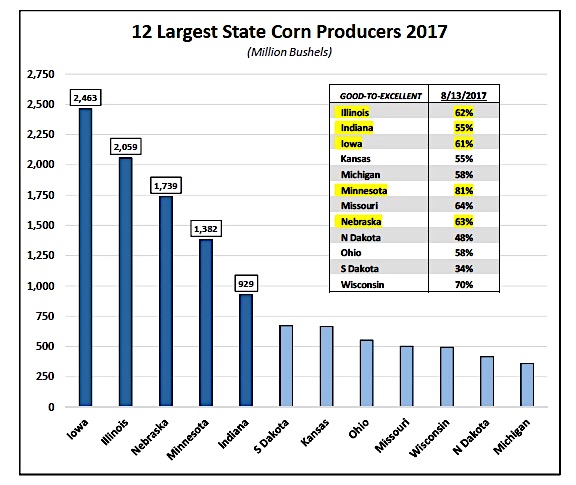
- Despite the U.S. corn good-to-excellent rating improving, Iowa’s rating continued to slide lower. Iowa’s good-to-excellent rating in corn fell to 61%, down 17% versus July 2nd. Iowa’s a massive swing state as it relates to its singular ability to influence the final national corn yield. In August NASS estimated Iowa’s corn yield at 188 bpa, which if realized would be the 3rd highest on record. Iowa’s current good-to-excellent rating of 61% compares to 83% in 2016, 82% in 2015, and 75% in 2014 as of mid-August. Iowa ranks as the U.S.’s largest state corn producer, accounting for on average 17.2% of total U.S. corn production from 2012-2016. 2017 state corn production has been forecasted at 2.463 billion bushels versus 2.741 billion in 2016, which is nearly equal to the combined corn production in South Dakota, North Dakota, Ohio, Wisconsin, and Michigan.
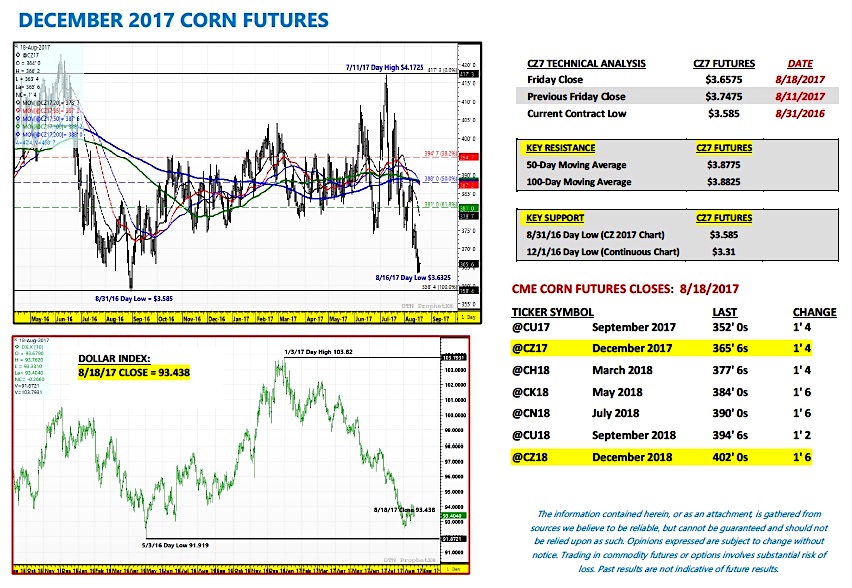
- On Wednesday, December 2017 corn futures traded down to their lowest level since September 1st, 2016, making a day low of $3.63 ¼. Despite the attempt by Corn Bulls this week to shift the narrative away from the undeniably Bearish August 2017 WASDE & Production reports, corn futures continued to move lower. December Corn Futures closed down 9-cents per bushel week-on-week. The latest Commitment of Traders report showed money managers sellers of over 27,000 corn contracts as of the market close on August 15th. However that still left the Managed Money long in corn at +39,802 contracts.
DECEMBER CORN FUTURES (CZ7) TRADING OUTLOOK:
The question moving forward is, “Can corn futures stop the bleeding with Crop Ratings improving both nationally week-on-week and more specifically in the Western Corn Belt?” If traders decide to the trade the trend in the good-to-excellent rating (higher) versus the actual figure itself (which as I stated earlier doesn’t seem to support NASS’s August U.S. corn yield forecast of 169.5 bpa), December corn futures could continue to leak lower.
What do the charts indicate? Last year under a similar U.S. corn S&D scenario December 2016 corn futures traded down to a day low of $3.25 on September 30th, 2016. Also of note, seasonally corn tends to trade sideways to lower during the month of September. That said I’m not expecting a large push under $3.55 to $3.50 CZ7 this September; however based on last year’s pricing pattern, along with a Managed Money position that’s still net long, the possibility of a short-term sell-off below $3.50 can’t be eliminated.
The top priority for Corn Bulls is getting to the September Production report (released on 9/12/17) with December corn futures still holding $3.50. At that point Bulls will likely need a yield/carryout decrease of substance to avoid a repeat of 2016’s price action.
Thanks for reading and have a great week.
Twitter: @MarcusLudtke
Author hedges corn futures and may have a position at the time of publication. Any opinions expressed herein are solely those of the author, and do not in any way represent the views or opinions of any other person or entity.
Data References:
- USDA United States Department of Ag
- EIA Energy Information Association
- NASS National Agricultural Statistics Service


