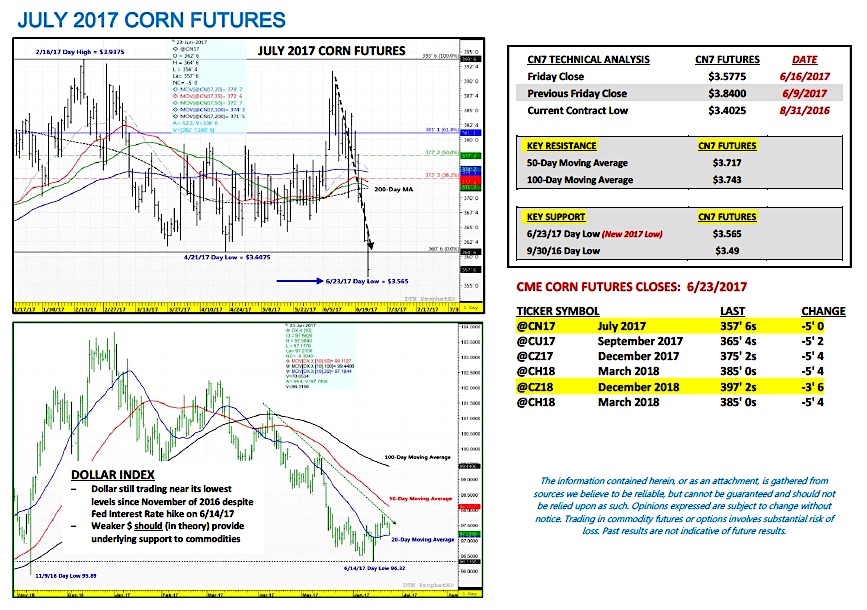
July corn futures moved sharply lower this week, closing down 26 ¼-cents per bushel week-on-week, finishing on Friday (6/23) at $3.57 ¾.
July corn futures established a new calendar year day low on Friday afternoon of $3.56 ½, exceeding the previous 2017 day low of $3.60 ¾ on 4/21/17.
Weekly Corn Price Drivers (6/19/17 – 6/23/17)
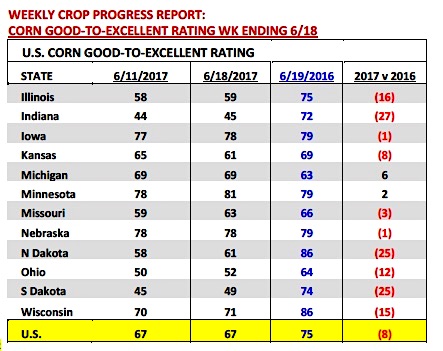
U.S. Corn Crop Ratings: Monday’s Crop Progress report showed the U.S. corn good-to-excellent rating unchanged week-on-week at 67% as of the week ending June 18th compared to 75% in 2016. The trade was largely anticipating a 1% improvement. That said there were minor improvements in Illinois and Indiana with both states seeing a nominal 1% increase in their good-to-excellent ratings. However with good-to-excellent ratings of 59% and 45% respectively, both states still remained well behind a year ago (Illinois -16% versus 2016, Indiana -27% versus 2016).
Overall, of the top-12 corn producing states in the country only two currently have good-to-excellent ratings better than 2016. Minnesota’s corn crop was rated 81% good-to-excellent (+2% versus 2016) with Michigan’s crop rated 69% good-to-excellent (+6% versus 2016). Iowa and Nebraska were tracking very close to their good-to-excellent ratings from a year ago, both down just 1% versus 2016. Meanwhile Missouri’s good-to-excellent rating of 63% was down just 3% from 2016. However the other top producers of Illinois, Indiana, Kansas, North Dakota, Ohio, South Dakota, and Wisconsin all had good-to-excellent ratings ranging from 8% to 27% BELOW 2016.
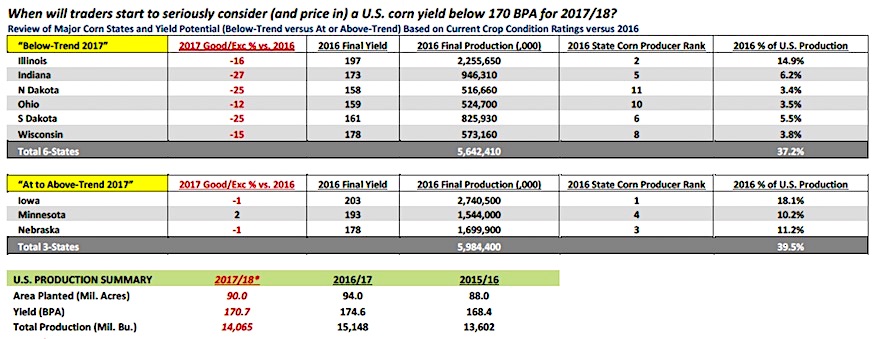
I’ve been asked, “Is it fair to compare 2017’s good-to-excellent rating to a year ago with 2016’s rating corresponding to a record high corn yield totaling 174.6 bushels per acre in 2016/17?” Translation being… isn’t the current good-to-excellent of 67%, although 8% lower than last year, still “good enough” to justify a U.S. corn yield at or near 170 to 171 bpa?
If we compare this year’s rating to 2014 (which produced a final U.S. corn yield of 171 bpa in 2014/15), the 2014 U.S. corn crop was rated 74% good-to-excellent as of June 22nd, 2014. In 2015 (which produced a final U.S. corn yield of 168.4 bpa in 2015/16), the 2015 U.S. corn crop was rated 71% good-to-excellent as of June 21st, 2015. Therefore if we look at the current U.S. corn good-to-excellent rating objectively, we’d still have to draw the conclusion that this year’s crop is poised for a yield less than 168.4 bpa based purely on ratings over the last 3-crop years. That said I have seen one notable private analyst now projecting a 2017/18 U.S. corn yield of 167 bpa versus the USDA’s June estimate of 170.7 bpa. I’m assuming others will start to lower their yield expectations as well in coming weeks IF corn’s good-to-excellent rating remains under 70%.
Slumping Corn-Ethanol Demand: The EIA estimated weekly U.S. ethanol production at 990,000 barrels per day for the week ending 6/16/2017. Through 3-weeks of June U.S. weekly ethanol production has now averaged a disappointing 997,000 barrels per day versus the 2017 calendar year average of 1,023,700 bpd. As a result corn-ethanol demand has been slipping despite weakening corn futures prices, end-user advantageous spot Midwest corn basis levels, as well as, industry positive ethanol margins. And while spot CME ethanol futures have broken, the decrease in corn futures has been more exaggerated as it relates to the net impact on ethanol crush margins. This week July ethanol futures were down 7.5-cents per gallon (corn bushel equivalent -21.375 cents per bushel) versus a -26 ¼ cents per bushel decrease in July corn futures.
KEY PRICING CONSIDERATIONS FOR JULY CORN FUTURES
Cooler / Wetter Weather Pattern Pressuring Prices…
Producers took it on the chin this week with July corn futures rolling over on the very day (June 19th) the 5 and 10-year pricing seasonals said they would. The end result was a new 2017 calendar year day low being achieved in CN on Friday afternoon of $3.56 ½, exceeding the previous low water mark of $3.60 ¾ from 4/21/17. The selling was directly attributed to a significantly cooler and wetter weather pattern, persisting now into the first week of July for the vast majority of the Corn Belt (see weather models on page 5). Last half June rallies in July corn futures have always been at the mercy of a notable shift in the weather pattern, and thus far, 2017 is proving to be no different.
This begs the question for Corn Bulls, “Is it game over or are corn rallies still possible in the next 30 to 45-days?” 3 things need to happen in my opinion to reignite corn prices to the upside:
- Corn Bulls need a favorable acreage number and/or June 1 stocks number in next Friday’s (6/30) June Acreage and Stocks report (something well below the average trade guesses). This report has a history of creating volatile pricing reactions. In just the last 4 years this report has generated double digit price responses on the day of its release. In 2013, 2014, and 2016 corn futures closed sharply lower (average decrease of -20.3 cents per bushel versus the CU); however in 2015 corn futures closed up 30-cents per bushel (again versus the CU) on the day of this report.
- Corn Bulls need next Monday’s Weekly Crop Progress report to show just limited improvement in corn condition ratings despite the drastic change in the weather pattern. If Illinois, Indiana, and Ohio show only marginal increases in their good-to-excellent ratings, coupled with a similar response in South Dakota in the WCB, I think traders will still lean toward discounting the USDA’s current 2017/18 yield estimate by 2 to 3 bushels per acre.
- Corn Bulls need some “hot and dry” headline for the Midwest at some point during the month of July. Given the current cooler temperatures it’s possible the majority of the U.S. corn crop will pollinate later than normal making it more susceptible to heat in late July. Therefore a “weather scare” would help the Bullish narrative immensely even if it comes later in the growing season.
The caution here however needs to be that if points 1, 2, and 3 don’t occur in some combination corn prices can still go lower. In 2016 September corn futures traded down to a day low of $3.01 on 8/31/16 with December corn futures breaking to $3.14 ¾ on the same day. Therefore it would be naïve to think the worst must be over to the downside despite this week’s sloppy price action.
Thanks for reading.
Twitter: @MarcusLudtke
Author hedges corn futures and may have a position at the time of publication. Any opinions expressed herein are solely those of the author, and do not in any way represent the views or opinions of any other person or entity.
Data References:
- USDA United States Department of Ag
- EIA Energy Information Association
- NASS National Agricultural Statistics Service

 Trading Near Top Of Price Range")


