December corn futures closed down 1.5 cents last week to close at just over $3.69. The trade action was disappointing, but perhaps there’s a silver lining for Corn bulls.
Let’s review current news, data releases, and market trends with a look to the week ahead (November 12).
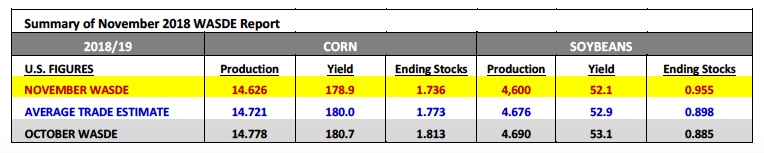
The USDA LOWERED its 2018/19 U.S. corn yield forecast to 178.9 bpa, well below the average trade guess of 180.0 bpa and a 1.8 bpa decline versus the USDA’s October estimate of 180.7 bpa.
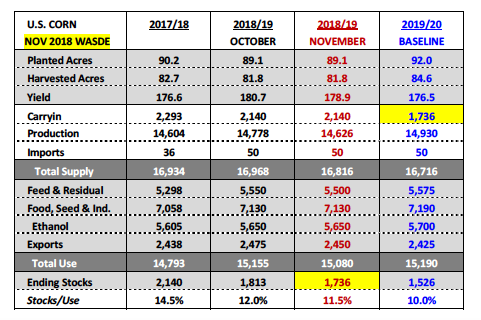
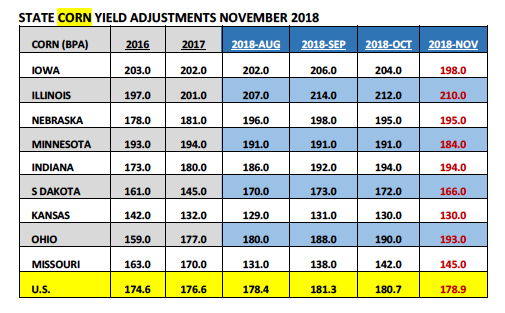
U.S. corn production dropped to 14.626 billion bushels, down 152 million bushels from October. Meanwhile 2018/19 U.S. corn ending stocks penciled back at 1.736 billion bushels versus the average trade guess of 1.773 billion and the October estimate of 1.813 billion. The revised U.S. corn stocks-to-use ratio fell to 11.5%; the lowest since 2013/14. STATE LEVEL —- Several key corn producing states saw their yields slashed from the previous month with Iowa’s state corn yield falling to 198 bpa versus 204 bpa in October.
Minnesota’s corn yield was lowered 7 bpa to 184 bpa. Even Illinois couldn’t escape without experiencing a 2 bpa yield decrease. Illinois’s corn yield was estimated at 210 bpa versus 212 bpa in October. It’s become apparent that the unfavorably wet, cold, and windy weather conditions that plagued the upper Midwest during early October had a significantly negative impact on corn yields in states such as South Dakota, Minnesota, and Iowa (specifically northern Iowa). I have to believe most traders will now assume another national corn yield decrease is coming in the January 2019 WASDE report (remembering again the USDA does NOT adjust the U.S. corn yield in its December report).
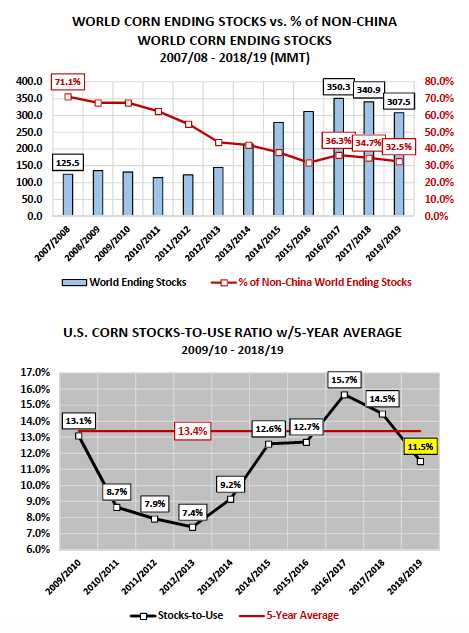
The other major surprise occurred in the form of the USDA revising its corn production, domestic consumption, and ending stocks figures for China dating back to 2007/08. Those adjustments would prove to have an incredible impact on World corn ending stocks. As a result 2018/19 World corn ending stocks increased to 307.5 MMT in November, representing a 54% increase versus October.
2017/18 World corn ending stocks were adjusted upward to 340.2 MMT, up +72% versus October (see chart on page 2). Initially it appeared the market had no idea how to price in such seismic revisions. That said, over the course of Thursday’s trading session a conclusion appeared to be drawn that since the increases in World corn stocks were solely a byproduct of adjusting higher Chinese corn production and Chinese corn ending stocks (supplies the world market often discounts anyway considering China is a nominal corn importer and non-corn exporter), the more appropriate way to assess realWorld corn ending socks was to subtract China’s corn stocks from the World total. That math would eventually show Non-China World corn ending stocks for 2018/19 of 100 MMT, well-below the 5-year average of 110.3 MMT.
Additionally on a percentage basis, Non-China World corn ending stocks fell to 32.5%, the second lowest percentage since 2007/08. I firmly believe that a big reason why corn futures recovered to close in positive territory Thursday afternoon was traders being able to, over time, rationally digest how to interpret the USDA’s new World corn carryout figures.
The USDA LOWERED its 2018/19 U.S. soybean yield forecast to 52.1 bpa versus the average trade guess of 52.9 bpa and the October estimate of 52.1 bpa. U.S. soybean production dropped to 4.600 billion bushels, down 90 million bushels from October. HOWEVER despite the larger than expected yield cut, 2018/19 U.S. soybean ending stocks increased to 955 million bushels, up 70 million from September and up +118% versus 2017/18.
On Thursday the General Administration of Customs released data showing China, the world’s largest soybean buyer, importing 6.92 MMT of soybeans during the month of October. This was up 18% from the same month in 2017; however down 13.6% versus September 2018.China continues to be an aggressive buyer of Brazilian soybeans, essentially stockpiling South American supplies in advance of Brazil’s 2018/19 soybean harvest, which likely won’t start until last half January at the earliest.
Meanwhile U.S. soybean export sales continue to disappoint with total crop year-to-date 2018/19 sales now 31% behind a year ago as of the week ending November 1st, 2018.U.S. soybean exports to China have been virtually non-existent in recent months, which appears to be a coordinated effort on the part of Chinese buyers. China has largely avoided U.S. soybeans (regardless of cost, inclusive of tariff) with the U.S. and China still very much muddled in a trade war. In the November 2018 WASDE report the USDA finally made an aggressive cut to 2018/19 U.S. soybean exports of 160 million bushels month-on-month to reflect the ongoing absence of Chinese purchases.
It should be noted the USDA did lower China’s total 2018/19 soybean imports to 90 MMT in the November WASDE report.
Meanwhile combined Brazil and Argentina soybean exports were raised to 85 MMT, nearly offsetting China’s entire import needs.
DECEMBER CORN FUTURES TRADING OUTLOOK
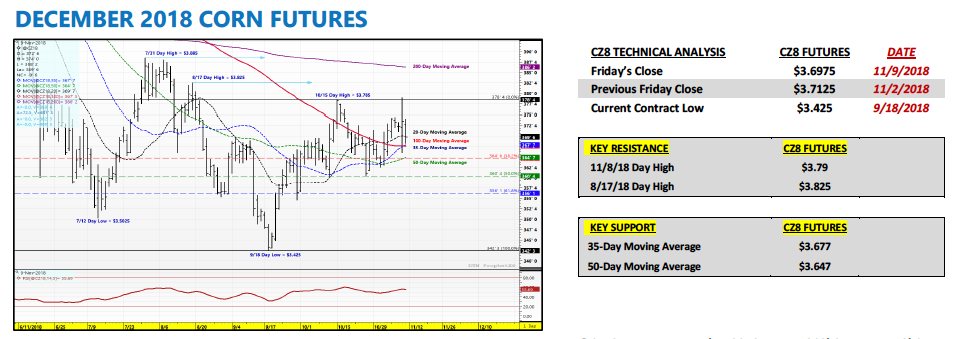
In a week that featured several market-making headlines including mid-term U.S. elections, Chinese October trade data and the November 2018 WASDE report, Friday’s December corn futures close still looked very similar to a week ago.
What does this say about current market conditions? I think it speaks to the time of the year more than anything. I had mentioned recently that since 2014, only once had December corn futures traded higher after the release of the November WASDE report; and even that year (2014) the “rally” proved short-lived (just 3-trading sessions). Therefore the sideways to lower price seasonal usually wins in November, regardless of evolving corn market fundamentals.
That said looking ahead to 2019, I remain extremely confident there will be better pricing opportunities moving forward as the market focus transitions to the 2019/20 U.S. corn S&D, likely beginning in early February 2019.
Why is that? If you take some time to analyze the real impact of the November 2018 WASDE report, the key takeaway for me was that 2019/20 U.S. corn carryin stocks continued to leak lower. As it stands currently if we apply the USDA’s revised November 2018/19 U.S. corn ending stocks figure of 1.736 billion (which in turn becomes next year’s carryin stocks) to the USDA’s recently released 2019/20 U.S. corn Baseline S&D estimates, 2019/20 U.S. corn ending stocks are projected to fall to 1.526 billion bushels (stocks-to-use ratio of just 10%).And that’s assuming 2019/20 U.S. corn planted acreage increases 2.9 million acres and the U.S. achieves a final corn yield of 176.5 bpa next summer/fall. I would argue those are some generous assumptions…
Furthermore historically speaking anytime carryin stocks haven’t necessarily provided an adequate supply cushion leading into the March Prospective Plantings report, the corn market has often added a “premium” to futures prices.
I would suspect that’s what we’ll see in Q1 2019; that being corn prices with relatively strong underlying price support. Please note this is very dissimilar compared to the last two crop years (2017/18 and 2018/19), which featured massive carryin stocks of 2.293 billion bushels and 2.140 billion bushels respectively.
Overall Take: Despite a disappointing weekly corn close for Corn Bulls, I remain optimistic longer-term. I find the “Bullish” argument for future corn rallies in 2019 the strongest it’s been in approximately 3-years.
Twitter: @MarcusLudtke
Author hedges corn futures and may have a position at the time of publication. Any opinions expressed herein are solely those of the author, and do not in any way represent the views or opinions of any other person or entity.
Data References:
- USDA United States Department of Ag
- EIA Energy Information Association
- NASS National Agricultural Statistics Service

: Worrisome to Broader Market?")


