While Canadian stocks have been setting new highs, it appears some headwinds may be approaching for our northern neighbor. If we were to look at just the pure price action then things would look pretty good for the iShares Canada ETF (EWC). Price has broken above the previous high set in 2011. However, it’s when we look under the surface that we can see some problems.
The chart below shows EWC on a weekly basis going back to late 2010. On the top panel I’ve included the Relative Strength Index (RSI) which is a momentum indicator. Two weeks ago Canadian stocks made an attempt to break its July high but ended up producing a false break as price was unable to hold above $32.90.
We also saw the RSI indicator make a lower high, creating a divergence with price. When this momentum indicator goes from being ‘overbought’ by being above 70 to creating a lower low under this level, it typically is followed by exhaustion in price as things start to weaken. While this chart shows the weekly data, a more pronounced bearish signal can also be found on the daily timeframe.
Another interesting development for this Canadian ETF is its relative performance to U.S. stocks, specifically the S&P 500. The bottom panel of the chart shows the ratio between EWC and the S&P 500. As the line rises we know that EWC is outperforming the U.S. index – by either falling less or rising more. The relative performance between Canada and the U.S. has been in a well-defined downtrend since the 2011 peak in EWC. However, as 2014 got started we began to see some strength in EWC relative to the S&P 500 as Canadian stocks began to outperform. This lasted five months before the ratio began to fall, also creating a negative divergence with the price action of EWC.
EWC iShares Canada Weekly Stock Chart
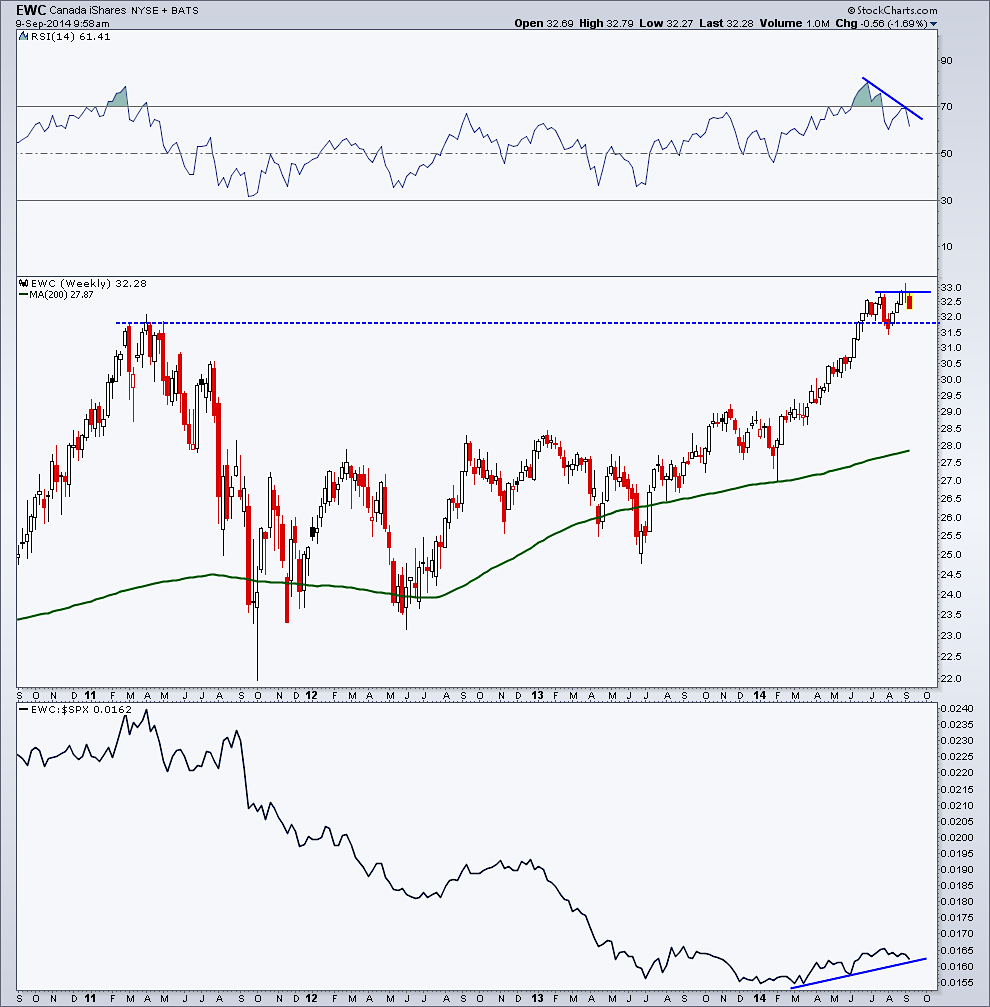
If price continues to fall I’ll be watching to see if that 2011 peak around $31.80 can act as support or if we fall below the most recent low of $31.50 as EWC heads into a potential correction. If price does strengthen then the divergence in momentum will need to be corrected by the RSI indicator getting back above 70 at some point.
The information contained in this article should not be construed as investment advice, research, or an offer to buy or sell securities. Everything written here is meant for educational and entertainment purposes only. I or my affiliates may hold positions in securities mentioned.
Any opinions expressed herein are solely those of the author, and do not in any way represent the views or opinions of any other person or entity.

: Worrisome to Broader Market?")

