The stock market appears to be in some trouble here, with several leaders such as Google (NASDAQ: GOOGL) stumbling.
So what is this soldier of the market revealing? A potential longer-term top.
Triple Trouble for Google’s Stock Price
Technical Analysis is showing the presence of significant resistance in the ~1290 price, which has now become more evident but there are multiple dimensions and mathematical equations that provided astonishing yet logical clarity.
Some of the calculations revealed as early as 2013 a longer term target area, that we have just now reached (at point D).
Google Stock Chart (GOOGL) – Is the top in?
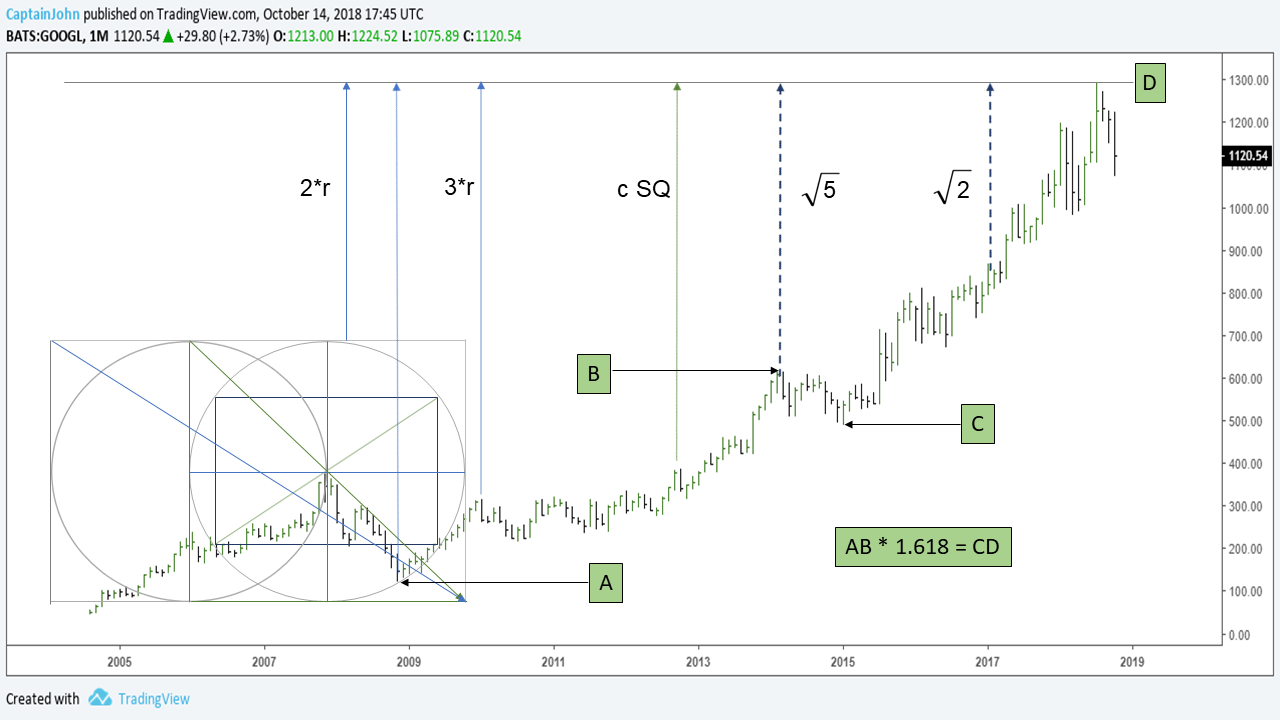
The big question now: Is Google’s stock topping?
Three mathematical points to consider for this being the top. Now.
Point 1. The distance of AB times 1.618, equals the distance of C to D! Revealing a top.
Point 2. Square root vectors also align to the same price area in perfect precision, like mathematical certainties. They pointed there long before anyone was thinking, “Top. Now.”
Point 3. Geometry such as radius, diameter, and diagonals all line up to the exact same area.
Also consider that the daily Point and Figure chart shows a bearish price objective of 931.0
In conclusion, this soldier of the market is taking leave. At least, temporarily.
Please note that CaptainJohnCharts.com is now alexanderandswartz.com. Please update your bookmarks.
Twitter: @CptJohnCharts & @FortunaEquitis
The author may have a position in mentioned securities at the time of publication. Any opinions expressed herein are solely those of the author, and do not in any way represent the views or opinions of any other person or entity.


