Treasury bonds have underperformed other major asset classes since topping last summer. But the 20+ Year Treasury Bond ETF (NASDAQ:TLT) may be finding some footing.
That is, IF the chart pattern show below is confirmed.
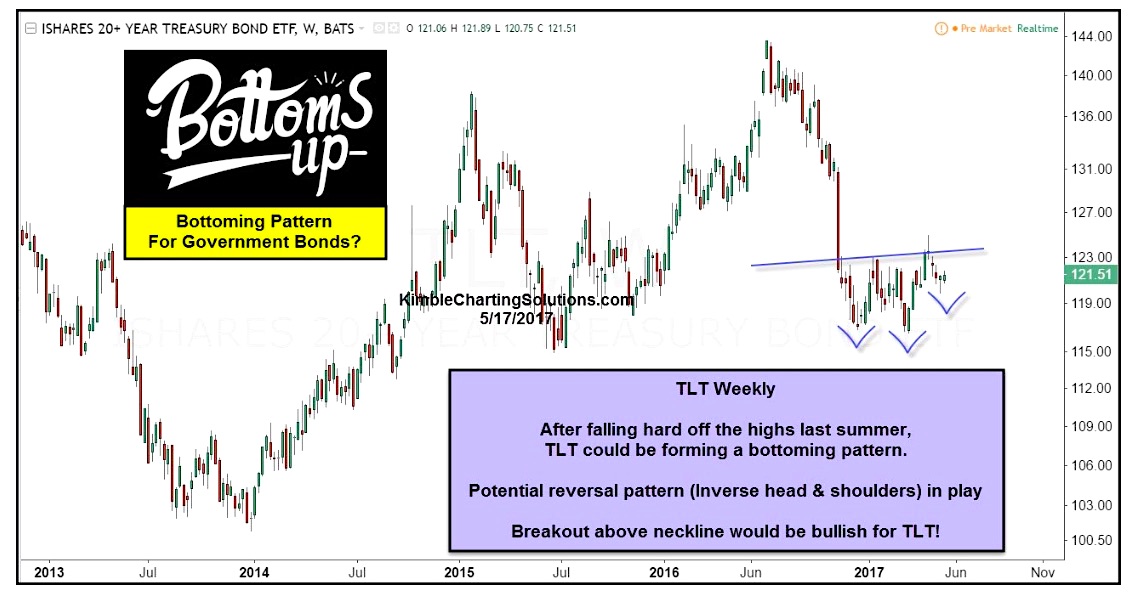
I shared the chart below last Wednesday. And, as you can see, bonds (via TLT) are in the process of forming a triple bottom. In fact, when we factor in the rally Wed-Fri of last week, TLT is right at the neckline of the pattern (after closing at 123.71 on Friday).
Keep an eye on that blue neckline. A breakout higher would confirm a bullish reversal for bonds that would change the current dynamic in the market. BUT, the pattern has not yet been confirmed so patience is key.
20 Year Treasury Bond ETF (TLT) Chart – Bottoms Up?
Thanks for reading and have a great weekend.
ALSO READ: Trading Setup In Junior Gold Miners
Twitter: @KimbleCharting
Any opinions expressed herein are solely those of the author, and do not in any way represent the views or opinions of any other person or entity.
: Creating Bullish Divergence?")


 and Semiconductors (SMH): Concerning Price Pattern?")


