The 20+ Year Treasury Bond ETF (NASDAQ:TLT) is attempting to breakout here. But it’s worth noting that this is the fourth attempt to take out the 2017 highs.
Needless to say, this area of price resistance has become pretty clear cut. So what happens in the coming days will likely bear importance on the ETF’s next move.
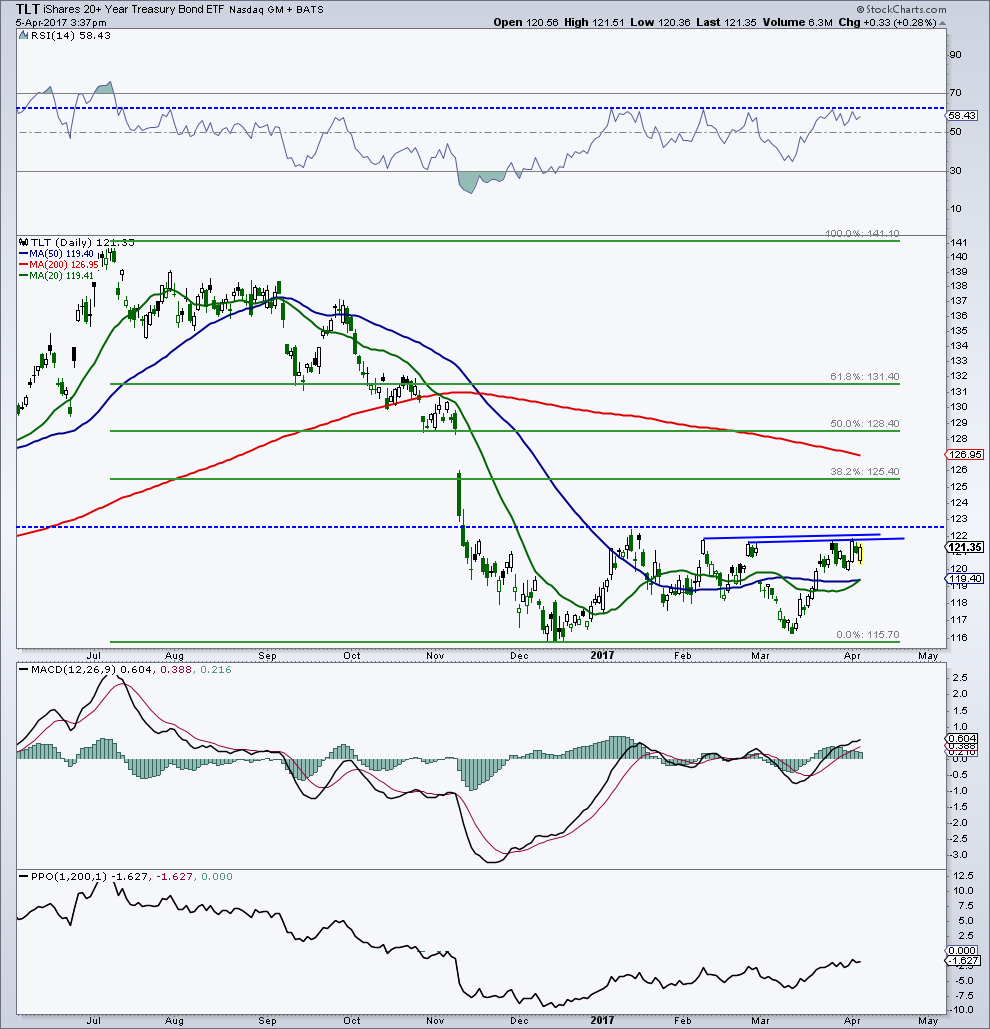
Key Level to Watch: 122.38 (2017’s closing highs)
If Bulls can manage to breakout above this key level, then it would put 125 to 128 in focus. On the other hand, another rejection here would be a victory for bond bears. Buckle up, there’s a jobs report tomorrow!
20+ Year Treasury Bonds ETF (TLT) Chart
Note that I’m still long Treasuries via the 3X Treasury ETF (TMF).
Feel free to reach out to me at arbetermark@gmail.com for inquiries about my newsletter “On The Mark”. Thanks for reading.
READ: S&P 500 Chart: Key Fibonacci Support Levels
Twitter: @MarkArbeter
Any opinions expressed herein are solely those of the author, and do not in any way represent the views or opinions of any other person or entity.


")

