With the massive losses suffered (just kidding) during this pullback, I have seen some reprieve in many of the investor sentiment indicators I monitor. At it’s March lows, the S&P 500 (INDEXSP:.INX) was down 3.3%. It’s currently off just 1.6%.
A big part of the reason that I have been looking for a market pullback is that sentiment got too stretched to the bullish side of the table. The old ebb and flow of market opinion needed to be reset back toward neutral (at least) before the next upleg of the bull market could take us to new all time highs.
Is A Sentiment Reset Occurring?
Investor sentiment appears to be undergoing a stealth reset… So which sentiment indicators are resetting?
The 10-day average of the OEX put/call (p/c) ratio has fallen from the 1.75 area back to the 1.00 level following the recent market pullback. This is a smart money indicator so high (1.70 or above) levels are bearish for stocks while low (1.00 or lower) readings are bullish for stocks.
The 5-day CBOE equity-only p/c ratio was down at 0.57 in the middle of February and jumped to 0.70 at the pullback low. This is a contrarian or dumb money indicator so it’s best to do the opposite of these investors. Levels below 0.6 show a lot of bullishness in the options market and have preceded many pullbacks in recent years.
The NAAIM Exposure Index, which represents the average exposure to U.S. equity markets reported by their members, has declined from a very bullish (bearish from a contrarian view) reading of 102% in early March to 69% toward the end of March. During the election pullback, this index dipped just below 60% while during the major corrections in late 2015/early 2016, the exposure index fell well below 30.
The Rydex Ratio, which measures the total assets in bullish funds vs. assets in both bullish and bearish funds, has seen a big drop in bullish sentiment. The ratio has fallen from a recent 83% at the beginning of March to a recent and neutral 52%. In the past year, this volatile ratio has moved from near 30% on the downside to just above 80% on the upside.
One major sentiment worry for the longer term, however, comes from the Conference Board Consumer Confidence. The recent reading of 126 compares to 116 in 1973, 116 in 1987, 121 in 1989, 138 in 1998, 145 in 2000, and 112 in 2007. Those were not good times to invest in stocks. The other issue with this survey is that individuals are very bullish toward equities while very bearish toward bonds. This is certainly a warning that the bull market may be in its last innings and there will be a meaningful top over the next year or two.
S&P 500 Chart Update w/ potential Fib Levels To Watch
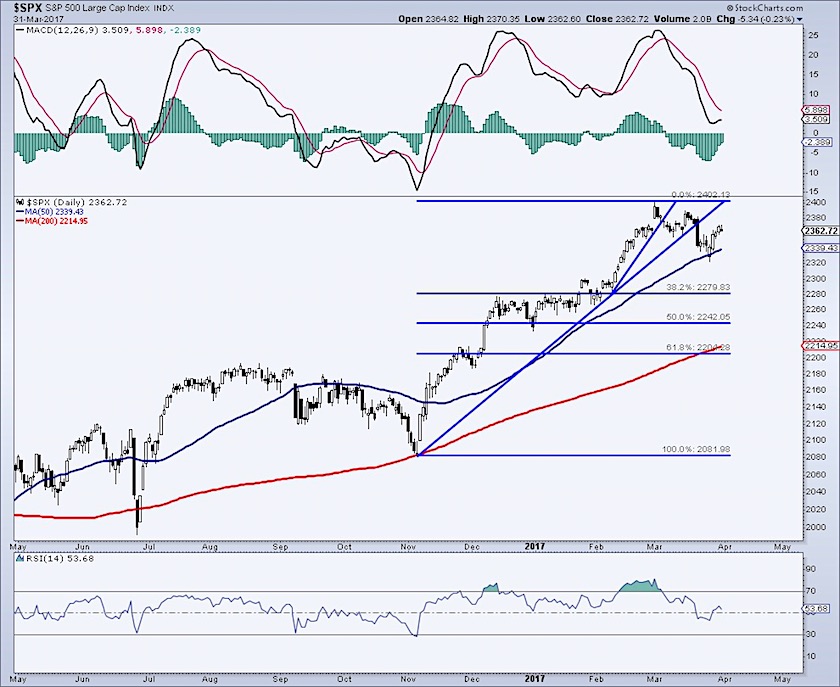
My Conclusion: I am still looking for a minor pullback, but remain bullish from an intermediate-term basis. Looking out, I see the S&P 500 reaching the 2,500+ region sometime this year.
Feel free to reach out to me at arbetermark@gmail.com for inquiries about my newsletter “On The Mark”. Thanks for reading.
Twitter: @MarkArbeter
Any opinions expressed herein are solely those of the author, and do not in any way represent the views or opinions of any other person or entity.


