In today’s article I will take a look at the 20+ Year Treasury Bond ETF (TLT) and highlight some potential downside price targets.
$TLT traders/investors should expect support to develop for a bounce from these price areas.
But before we look at an updated chart, let me provide a quick recap of my recent $TLT treasury bonds analysis and articles:
In October of 2017, I shared an analysis showing why $TLT was headed lower. At the time, bonds had rallied a bit, but patterns pointed to the next move being lower. Note the target zone depicted in that post.
We provided another “downside” update in May 2018.
And just last month (October), I wrote an article looking at the inverse of $TLT – the $TBT – approaching resistance near 40.00-42.50.
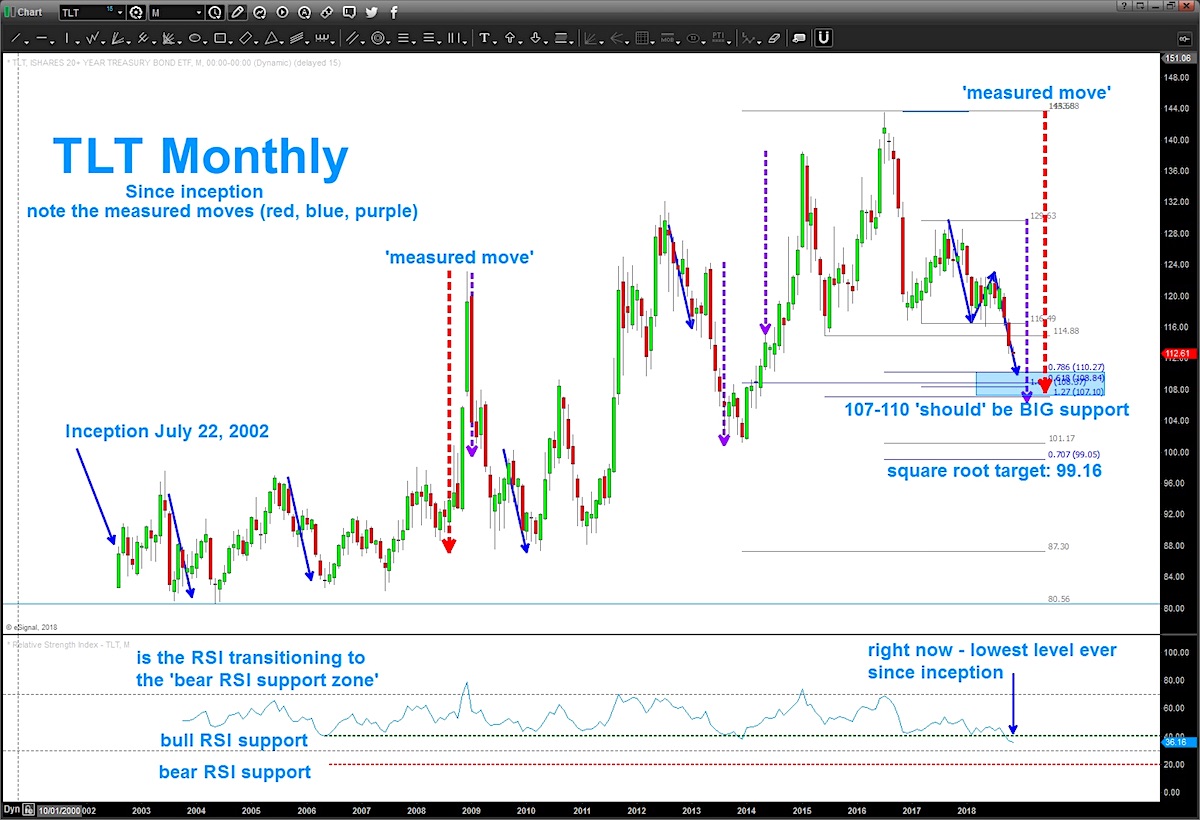
So where is $TLT now?
As you can see in the chart below, we are deeply oversold and the RSI is at its lowest level – ever.
What is interesting about this is – perhaps – we are shifting support zones in this security and this would highlight a potential change in trend. Additionally, we have a cluster of numbers coming in around the 107-110 level.
Lastly, note the measured moves that have been consistently harmonic with regard to the Treasury Bonds ETF (TLT). Certainly appears the 107-110 level will be very important support moving forward.
Be sure to check out my unique analysis of stocks, commodities, currencies over at Bart’s Charts. Stay tuned and thanks for reading.
Twitter: @BartsCharts
Author does not have a position in mentioned securities at the time of publication. Any opinions expressed herein are solely those of the author, and do not in any way represent the views or opinions of any other person or entity.


