Treasury bonds have left a bad taste in investors mouths for the past couple of years. And this collective “UGH!” comes after years of solid returns.
Will the bull market continue? Or is this the beginning of the end?
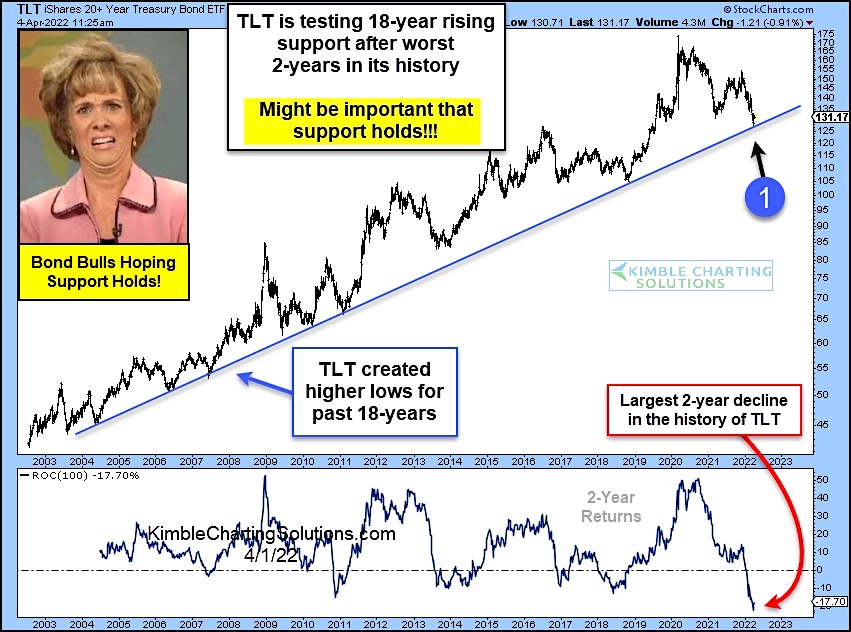
Today’s chart takes a look at the 20+ Year Treasury Bond ETF (TLT), highlighting how the latest selloff has TLT testing important 18-year trend support. And this comes as TLT is posting its worst 2-year rate of return in its history (-17.7%). Yikes!
Needless to say, bulls are hoping up-trend support holds at (1). If not, look out below. And if bond prices keep falling, then interest rates will likely keep rising. Stay tuned!
$TLT Long-Term Treasury Bonds ETF
Note that KimbleCharting is offering a 2 week Free trial to See It Market readers. Just send me an email to services@kimblechartingsolutions.com for details to get set up.
Twitter: @KimbleCharting
Any opinions expressed herein are solely those of the author, and do not in any way represent the views or opinions of any other person or entity.


