Just a few days after our March 18 post about the iShares 20+ Year Treasury Bond ETF, NYSEARCA: TLT, we saw price bounce as predicted. Now the move might be reaching its end.
The strength of the rally since last March has improved the case that TLT and bonds are progressing through a downward leading diagonal formation.
In Elliott wave parlance, leading diagonals are motive patterns in the sense that they often move price into a new range. They consist of five sub-waves wherein the fourth sub-wave overlaps the first.
Even apart from Elliott wave methods, the weekly chart of TLT shows several reasons to watch for an imminent turn. First, price is testing the upper boundary of a Schiff channel defined by the lower high that printed in August 2020.
Second, the quicker of the two cycles detectible in price action suggests TLT is entering a time of downward pressure.
Finally, note that the adaptive CCI oscillator is near it’s zero line – a development that often coincides with reversals.
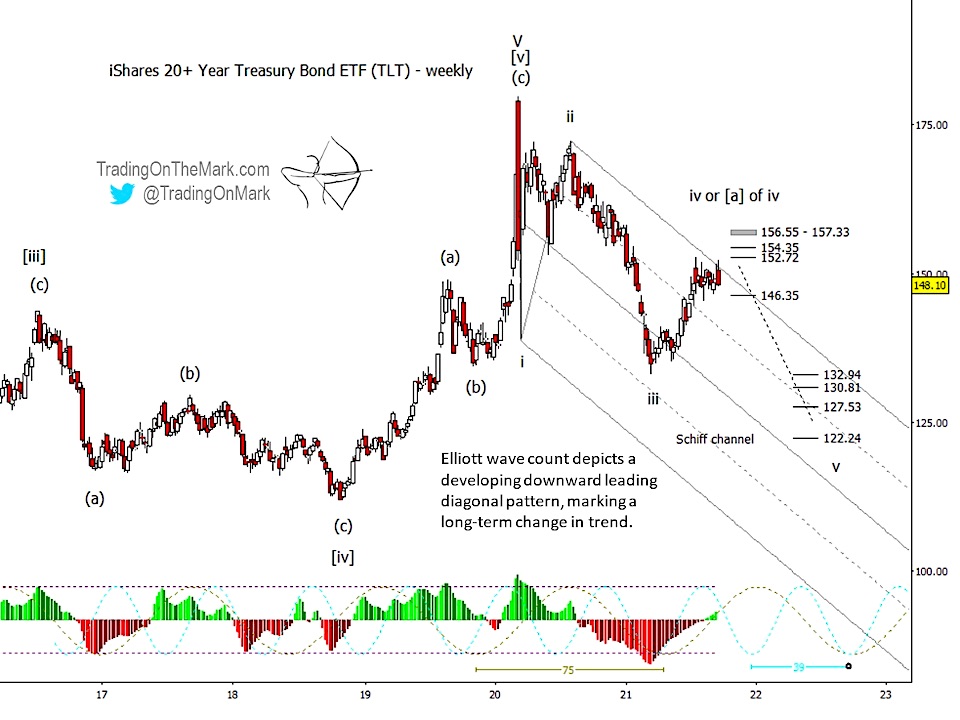
Although we believe the rally is nearly over, it’s impossible to know yet whether TLT is nearing completion of the entire fourth wave. The rally could be merely the first segment in a more complex, time-consuming pattern. Thus we have marked the present area as representing either wave ‘iv’ or ‘(a) of iv’.
Regardless of pattern, certain Fibonacci-based measurements put nearby resistance at 152.72, 154.35, and the zone from 156.55 to 157.33. If price makes a slightly higher high now above what we saw in July, then we expect at least the first of those levels to be tested.
A minor new high is not required though. Either way, a weekly close beneath 146.35 would strengthen the case that the next downward pattern segment has begun, which could represent the start of downward wave ‘v’ or merely downward sub-wave ‘(b) of iv’.
Some bigger-picture targets for support include 132.94, 130.81, 127.53 and 122.24. Note also that a confluence of cycles suggests TLT might see a low around autumn 2022.
The Elliott wave count shown above for TLT is similar to what we have for treasury bond futures. You can get daily and intraday charts and updates for that and other highly traded markets via page on Substack and on Twitter.
Twitter: @TradingOnMark
The authors may have a position in the mentioned securities at the time of publication. Any opinions expressed herein are solely those of the author, and do not in any way represent the views or opinions of any other person or entity.


