In our previous article, we looked at using the small cap Russell 2000 Volatility Index (INDEXCBOE:RVX) to better time long entries in the Russell 2000 Index (INDEXRUSSELL:RUT).
The Takeaway: Waiting for a 20 day or 50 day peak in the RVX proved to be a consistently favorable long entry on the RUT when held for 5, 10 or 30 days.
Furthermore, the average gains and profit to loss ratios for buying the RUT at RVX peaks significantly outperformed buying the RUT at RVX lows. For more stats, check out our article.
Timing a Better Small Caps Long
With the Russell 2000 Index (RUT) still sitting near the highs after the parabolic rise, the index has settled into a narrow price range, working off its overbought readings (as measured by the RSI) through price consolidation rather than a pullback. The RVX Russell 2000 Volatility Index closed at a 20 day high on Monday, October 9 when it hit the 15 level and the RUT closed at 1503.
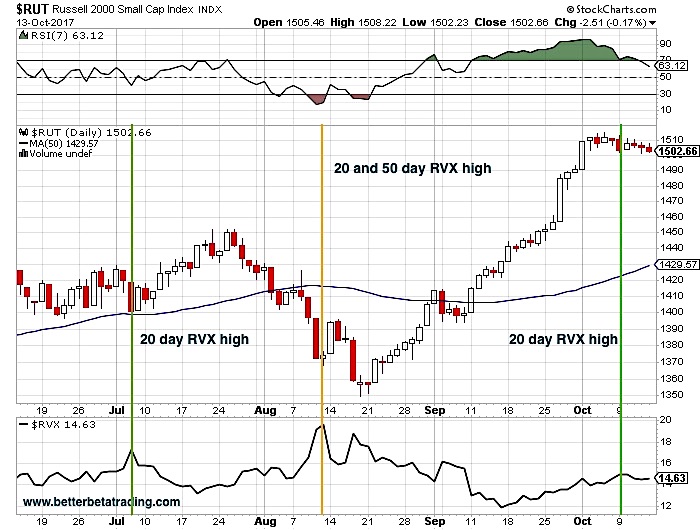
Since then, the Russell 2000 is down by less than a point while its volatility index (RVX) sits at 14.63. With equity volatility sitting at record lows over the past several months, it can be uncomfortable to get long the markets at these levels. But if the pattern holds, a long RUT entry at the 20 day RVX peak may be a favorable one. And for the less aggressive traders, waiting for a 50 day RVX peak – currently 19.59 – which hit August 11 when the RUT was trading at 1374.
Thanks for reading!
Any opinions expressed herein are solely those of the author, and do not in any way represent the views or opinions of any other person or entity.


 Testing Important Price Support")


")
