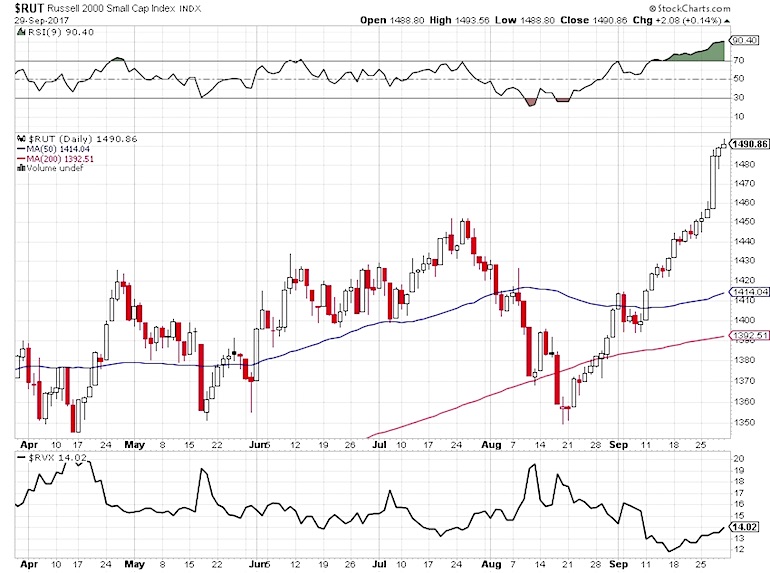
With the Russell 2000 index (INDEXRUSSELL:RUT) sitting at record highs, many traders are wondering how much longer it can continue to climb without a meaningful retracement.
Aside from a 0.75% pullback in early September, the move has been straight up.
While no trader wants to miss out on a strong move, there is also the nagging concern about entering a position too late and buying at the top. So we looked at the movement of the Russell 2000 Volatility Index (RVX) which measures the volatility of the Russell 2000 index. Think of it as the VIX for the Russell 2000 (RUT).
A quick glance at the chart below suggests that going long the RUT when the RVX “peaks” can result in favorable entry points. The most recent peaks at a glance include the mid-August spikes, early July and mid-May. The RUT was positive 10 days after each of the RVX peaks.
Russell 2000 (RUT) its Volatility Index (RVX)
The Benefits of RVX Volatility Peaks
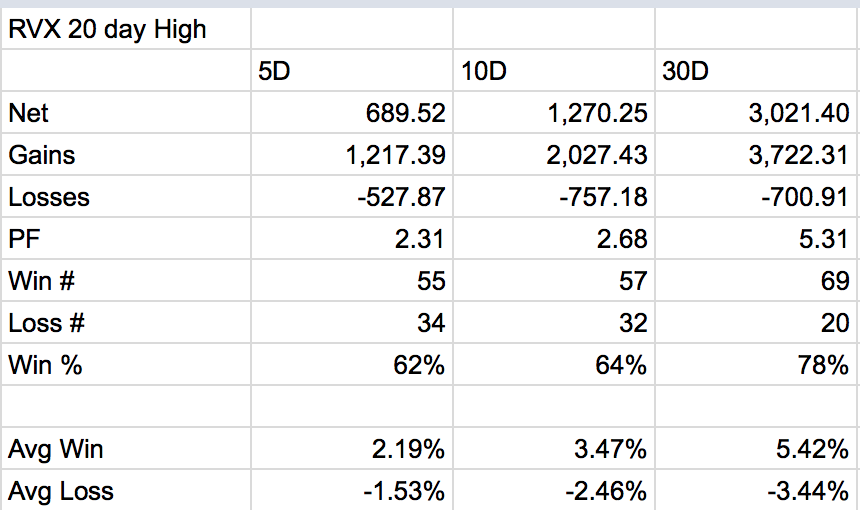
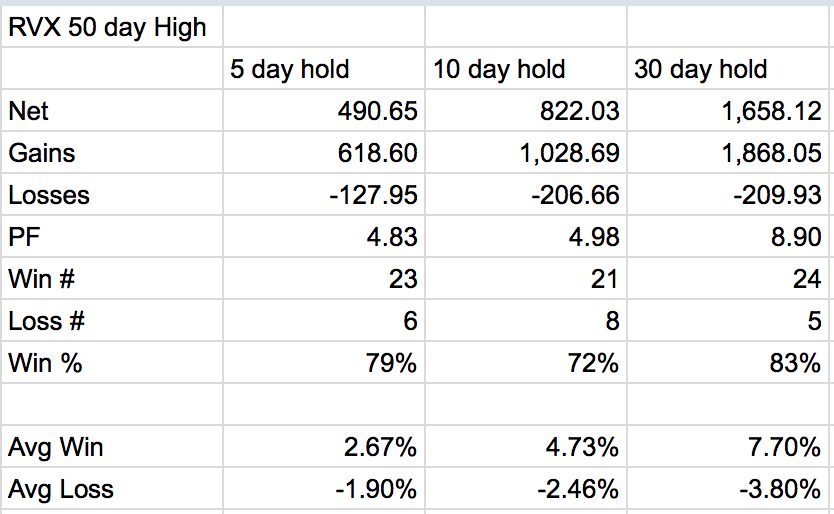
We ran the numbers on Russell 2000 Volatility Index (INDEXCBOE:RVX) peaks over the past 6 years (starting July 1, 2011) and defined the peaks as 10, 20 and 50 day highs. As we expected, the 10 day highs in the RVX led to many trades but didn’t typically signal a reversal of the RUT off of a tradable low. The 20 and 50 day peaks were much more profitable, with profit factors (total gains/total losses) ranging from 2.3 up to nearly 9. See tables for both the 20 day peaks and 50 day peaks below. Note that the Longer holding periods (comparing 5, 10 and 30 day holding periods) were most profitable.
ALSO READ: Ways to Trade Volatility Indexes
RVX Lows for the Shorts?
We also wanted to know if there was a downside when buying the RUT at lows in the RVX. Perhaps this could this be a good short set-up for the RUT? So we looked at the 10, 20 and 50 day lows in the RVX as places to enter long RUT positions.
Overall, the performance was nearly the same as buying and holding the RUT over the same time period. The profit factors were all around 1.4, regardless of holding period (5, 10 or 30 days) and the win rates were positive but the average gain and average losses were nearly identical. In anything but a reliable bull market with low volatility, this approach would likely not perform well in the real world. Factor in slippage and trading costs and it is a definite pass.
Next for the RUT?
With the RUT at all-time highs and the RVX in a middle range (but still below the typical 15 level), our study suggests we may see consolidation here. But the RVX alone does not have much to tell us about what is next for the small caps. Momentum indicators like the overheated RSI(9) in the chart above may provide more of a clue as we move in October.
Caveat(s): The above article is not a trading system but rather an initial exploration of the relationship between the RVX and RUT. We purposely choose static holding periods to isolate the entry signals. Much more work would need to be done to make this into a robust trading system. But it’s a place to start…
Thanks for reading!
Any opinions expressed herein are solely those of the author, and do not in any way represent the views or opinions of any other person or entity.


 Testing Important Price Support")
")
