VOLATILITY IS ALWAYS STRESSFUL
With lingering concerns about trade, markets sold off Monday with all three major U.S. indexes posting intraday declines of greater than 1%. Red screens create stress and doubt. Therefore, it can be helpful to take a step back and check the big picture.
In August 2016, the S&P 500’s 30, 40, and 50 week moving averages told us to be open to better than expected outcomes from a long-term perspective.
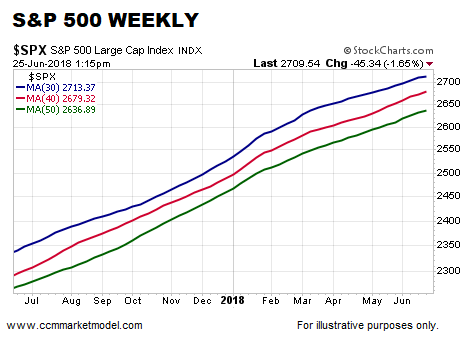
The chart below shows the same moving averages as of 1:15 pm ET Monday. The NASDAQ’s chart looks even better.
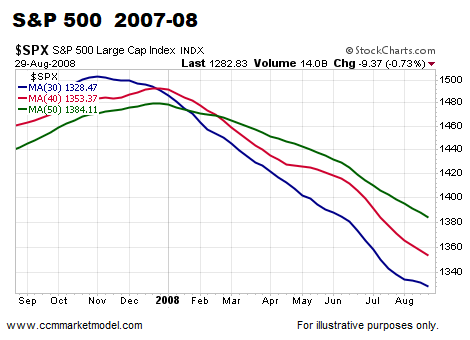
To give us a bearish reference point, the same weekly moving averages over a one-year period in 2007-08 are shown below.
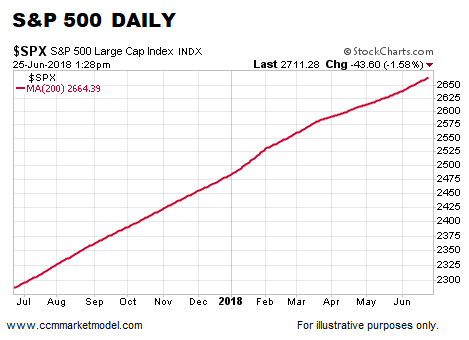
The daily chart below shows the S&P 500’s 200-day moving average as of 1:28 pm ET Monday. The NASDAQ’s 200-day paints a similar picture.
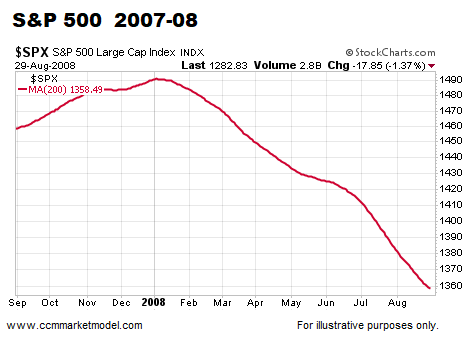
To give us a bearish reference point, below is the same 200-day moving average over a one-year period in 2007-08.
SOME HISTORICAL PERSPECTIVE
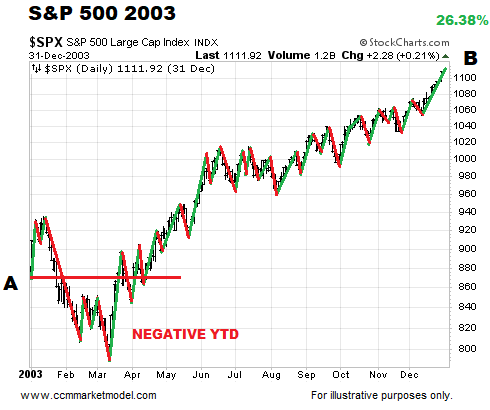
In May 2003, stocks had made little progress YTD. Despite numerous swings up and down into year-end, the S&P 500 finished with a very satisfying gain of 26.38%. Day-to-day volatility provided little in the way of useful information between points A and B.
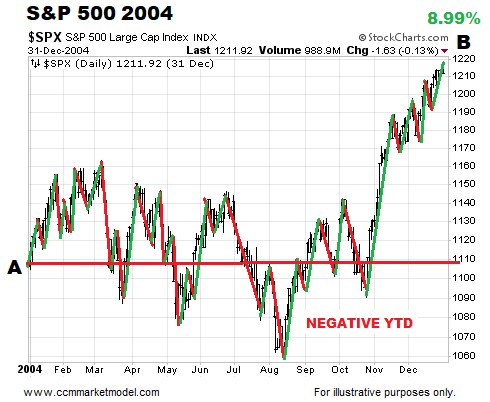
2004 featured numerous bouts of stress-inducing volatility, including the S&P 500 moving into negative territory YTD numerous times. Patient investors were rewarded with a gain of almost 9%. Even in the context of a longer-term bullish trend, volatility is to be expected.
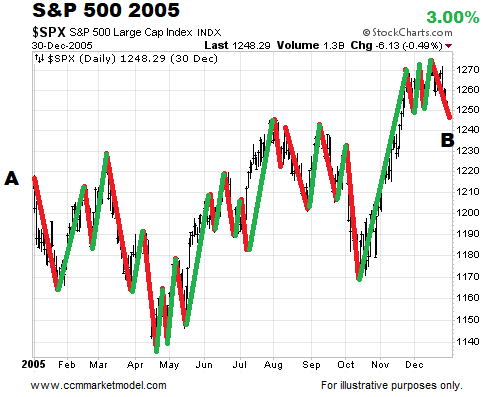
Trying to trade between point A and point B in 2005 proved to be a difficult task. When the volatility dust settled at the end of the year, the S&P 500 managed to post a positive gain.
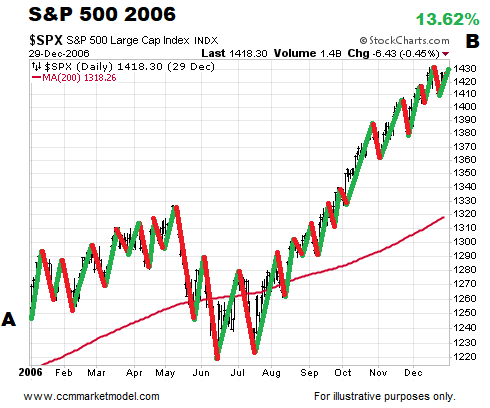
2006 featured several moves above and below the S&P 500’s 200-day moving average, along with a push into negative YTD territory as late as July. Once the summer doldrums passed, stocks rallied hard into year-end providing patient investors with a satisfying gain of 13.62%.
RESPECTING CONCERNS ABOUT TRADE
Based on the facts in hand today, the market’s longer-term trend remains constructive. With ongoing uncertainty related to the economic impact of trade tensions, it is important we continue to review the data day-by-day with a flexible, unbiased, and open mind.
Twitter: @CiovaccoCapital
The author or his clients may hold positions in mentioned securities at the time of publication. Any opinions expressed herein are solely those of the author, and do not in any way represent the views or opinions of any other person or entity.


