The selloff in US Treasury bonds has been intense. And it has rattled the financial markets.
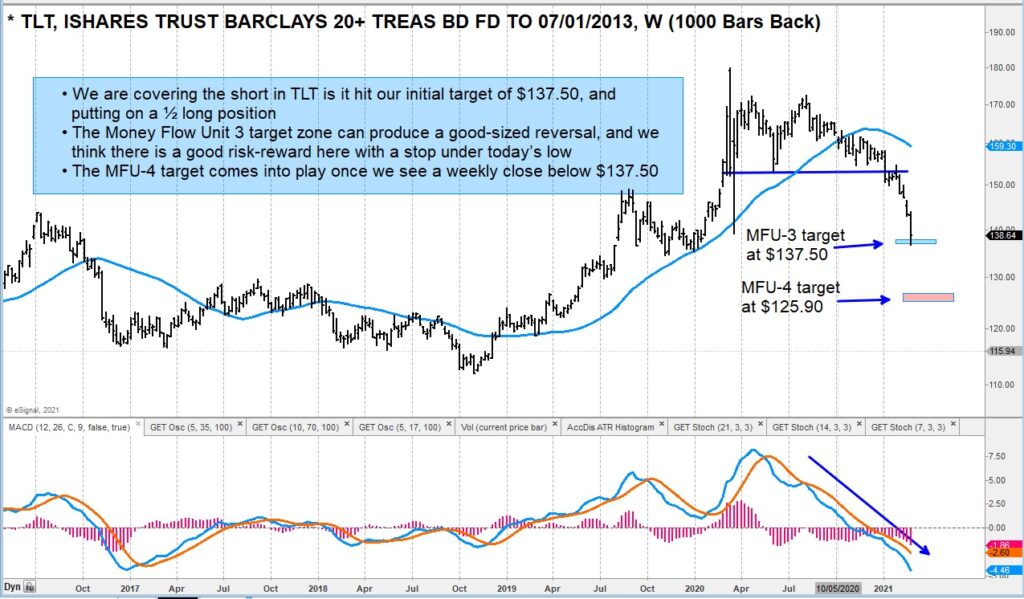
Last week, we provided an update with downside targets for the 20+ Year US Treasury Bond ETF (TLT). One of those extreme downside targets has been hit, which has changed our stance from bearish to neutral (perhaps even short-term bullish for traders).
Today we provide an updated chart highlighted those levels again. Note that (as stated in our previous article) the MFU-4 extreme target is hit only 30% of the time. So if price continues lower, then that is the next objective.
That said, the decline has been steep and momentum is getting oversold.
$TLT – 20+ Year US Treasury Bond ETF Chart
The author or his firm may have a position in mentioned securities at the time of publication. Any opinions expressed herein are solely those of the author, and do not in any way represent the views or opinions of any other person or entity.


