From 1999 to 2009, equities under-performed commodities. This culminated with the ’08-’09 Financial Crisis.
This was followed up by a 10+ year run of equities out-performance. Are the tables ready to turn yet again?
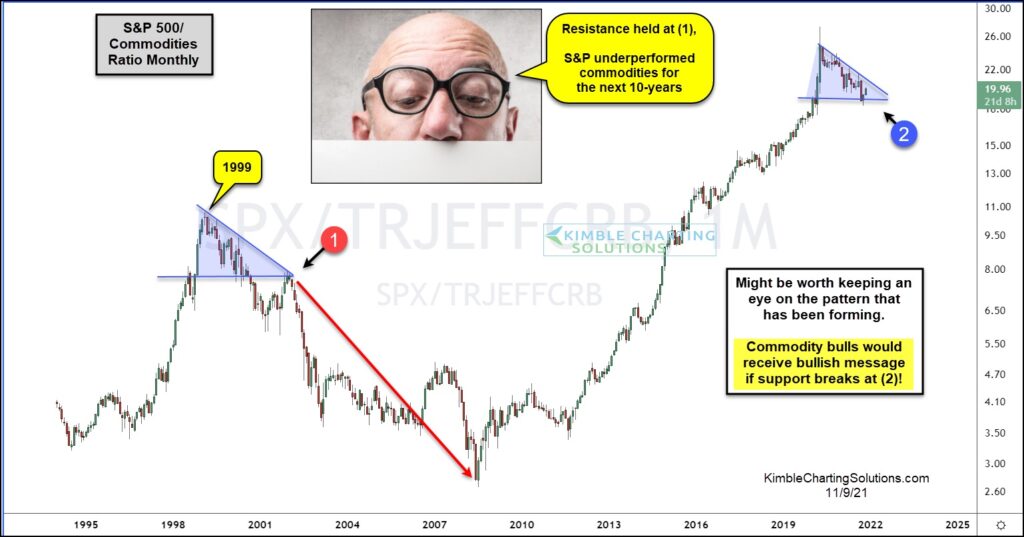
Today’s chart looks at the ratio of the S&P 500 Index to the Thomson Reuters CRB Commodities Index on a “monthly” basis.
As you can see, it might be worth keeping an eye on the triangle pattern that has been forming. The ratio peaked in 1999 and began forming a triangle pattern that saw support break and hold at (1). This lead to a period of equities under-performance. Fast-forward to today, and you can see a similar pattern has been taking shape, with important support developing at (2).
This is worrisome, as it is occurring amidst growing inflationary concerns.
If support at (2) should break, it would send a strong message to commodity bulls and increase the prospect of future price advances for commodities… this would also increase the prospect of equities under-performance for the foreseeable future. Stay tuned!
S&P 500 / Commodities Ratio “monthly” Chart
Note that KimbleCharting is offering a 2 week Free trial to See It Market readers. Just send me an email to services@kimblechartingsolutions.com for details to get set up.
Twitter: @KimbleCharting
Any opinions expressed herein are solely those of the author, and do not in any way represent the views or opinions of any other person or entity.
")


")
