One of my early mentors, Ralph Acampora, always told me to focus on price. If you know nothing else about stocks, analyze the price and it will tell you most of what you need to know.
Over my career, I’ve stayed true to that discipline, but I’ve also learned from mentors like Phil Roth (long-time technical analyst at Miller Tabak) and others of the importance of qualifying the major stock market index performance by analyzing breadth.
Market breadth measures participation. How are the stocks that make-up an index participating in the current trend? Toward the end of a bullish phase, you’ll often see a divergence where the indexes continue to move higher but the breadth measures trend lower.
How is this possible?
As a bull market becomes overextended, investors start to rotate to more defensive, blue-chip names to ride out potential turbulence. These mega-cap names are able to propel the indexes higher due to their size, even though many smaller names may have already broken down.
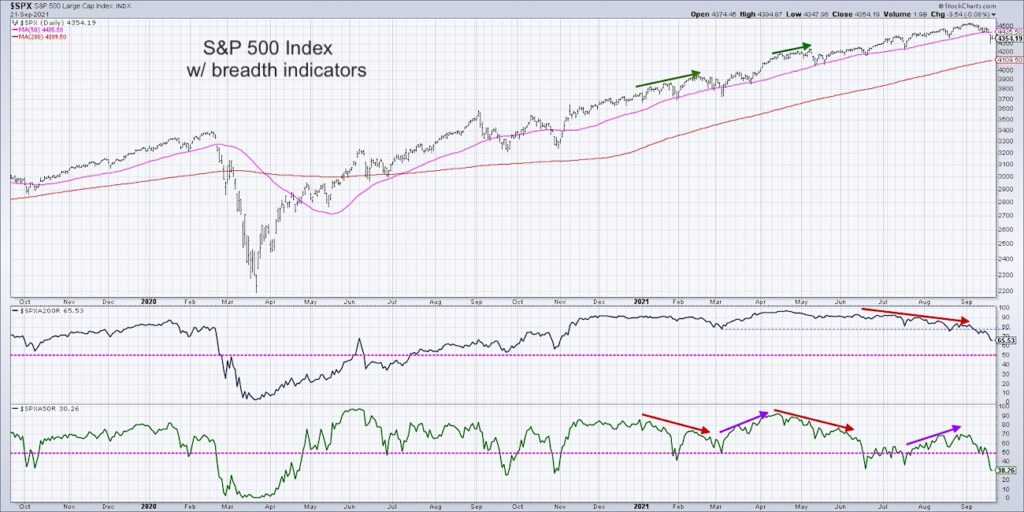
In today’s video, we’ll look at the S&P 500 Index while sharing three breadth indicators: cumulative advance-decline lines, percent of stocks above moving averages and bullish percent indexes. We’ll show how these indicators have rotated to a bearish phase in recent weeks which could suggest further deterioration for the S&P 500 Index. Here are a few questions we attempt to answer:
- How have the cumulative advance-decline lines been moving relative to one another, and what does the recent breakdown in these indicators tell us about the overall market configuration?
- How many stocks were above their 200-day moving averages back in April versus the most recent readings, and what does this tell us about distribution?
- What is the Bullish Percent Index, and does that confirm the bearish tilt in the other breadth indicators?
Ready to upgrade your investment process? Check out my free course on behavioral investing!
One Chart [VIDEO]: S&P 500 Index – Breadth Indicators
S&P 500 Index with Market Breadth Indicators
Twitter: @DKellerCMT
The author may have positions in mentioned securities at the time of publication. Any opinions expressed herein are solely those of the author, and do not in any way represent the views or opinions of any other person or entity.


