Stocks slipped last week but continue to be resilient. The S&P 500 Index (INDEXSP:.INX) declined 5 points on the week, but there could be more in play (and at stake) this week.
Looking ahead, things should get interesting, as the current market cycle points lower.
Market Summary:
- The S&P 500 moved lower last week, shedding 0.2%.
- Oil prices surged higher, as Saudi Arabia detained senior figures in a corruption crackdown.
- The US Congress unveiled two dramatically different tax plans, which the market viewed with concern.
S&P 500 market cycle chart
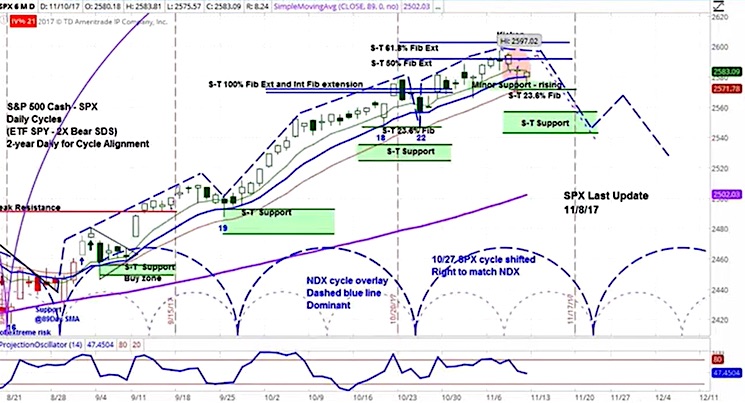
The stock market moved lower last week, with the S&P 500 (SPX) moving down 5 points to 2582.
On Monday, Saudi Crown Prince Mohammad bin Salman initiated a corruption crackdown, which involved detaining senior figures in the local Ritz-Carlton. This helped oil prices to surge higher by 2.8%. Led by energy stocks, this also pushed the SPX higher.
On Tuesday, speculation about difficulties that Congress may have in passing a new tax plan drove the small cap Russell 2000 (INDEXRUSSELL:RUT) lower by 1.3%. This was led by the financials which make up 18% of the index and who would be key beneficiaries of lower corporate tax rates.
On Thursday, Japan’s Nikkei index dropped 1.2%, leading markets lower internationally. The Nikkei had just reached a 25-year high a few days earlier, amidst President Trump’s in trip to Asia. Meanwhile the Senate unveiled its tax plan, which included corporate tax cuts that wouldn’t begin until 2019. The plan was viewed as dramatically different from the House plan, which added uncertainty as to whether Congress would be able to eventually pass legislation.
The S&P 500 closed 0.4% lower on Thursday, after having recovered from much steeper declines. The jitters continued into Friday’s session, with stocks closing 2 points lower.
The accompanying chart of the SPX shows our projection for this week: a move lower as the intermediate-term cycle comes to a close. This is the first leg of a longer corrective period for the stock market. The blue-dotted half circles at the bottom of the chart illustrate the short-term cycle patterns.
For more a more detailed look at cycle analysis for a broader selection of futures, watch the askSlim Market Week every Friday afternoon.
Here’s this week’s video:
Thanks for reading.
Twitter: @askslim
Any opinions expressed herein are solely those of the author, and do not in any way represent the views or opinions of any other person or entity.


