A Chilling View for those with 20/10 Vision
At 720 Global we follow a large number of fundamental and macroeconomic indicators to help forecast the markets. In addition we also monitor technical stock market indicators to gain further confidence when making market forecasts and assessing the likelihood of outcomes. Although we do not spend much time writing about technical analysis, we view it as an important tool in evaluating human investment behavior. When technical indicators line up with the fundamental metrics, the reinforcement provides a greater level of confidence in the analysis.
In this article we highlight a simple technical indicator that has proven prescient over the last 15 years for stocks. Currently, this stock market indicator supports much that we have posited regarding equity valuations and what they portend for the future direction of prices.
Moving Averages
Moving averages are the average price at which an index or security has traded over the last number of days, weeks, months or even years. For instance, today’s 20-day moving average for the S&P 500 is its average closing price over the prior 20 days. Many investors use moving averages to help gauge where a security or index may encounter support or resistance. Due to the widespread use of moving averages it is not uncommon to see prices gravitate toward moving averages.
Another way investors employ moving averages is to compare them across different time frames. For example, an investor may compare the 20-day moving average to the 50-day moving average. It is said that when a shorter term moving average is higher than a longer term moving average the underlying stock or index has positive momentum and vice versa. Therefore, when short term moving averages cross to the upside or the downside of longer term moving averages it can signal an inflection point where momentum has changed direction.
Now let’s look at an important longer term stock market indicator and see what it’s trying to tell us.
20/10 Moving Averages
The stock market indicator that is currently catching our attention, and may be worthy of your attention, is a comparison of the 10-month and 20-month moving averages on the monthly S&P 500 index. Monthly moving averages are similar to the aforementioned 20-day example but instead of daily closing prices, monthly closing prices are used.
The chart below shows the monthly price of the S&P 500 since 1999 in blue. It is flanked by the 10- and 20-month moving averages in green and red respectively. Note that when the 10-month moving average rises above the 20-month moving average, it has signaled the early stages of a sustained rally in the S&P 500. Conversely when the 10-month moving average falls below the 20-month moving average it has signaled a prolonged decline.
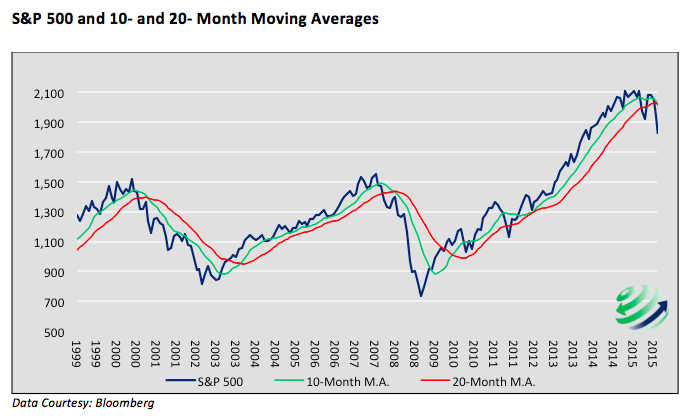
In the following graph we drew circles around the 3 instances that the 10-month moving average crossed below the 20-month moving average and “positive momentum stalled”. Alternatively boxes are used to show when the opposite happened and “negative momentum stalled”.

So How Is This Stock Market Indicator Setting Up Right Now?
The graph below enlarges the past year to show that as of late February 2016 the 10-month moving average dipped below the 20-month moving average – a potential indication of “stalled positive momentum”.
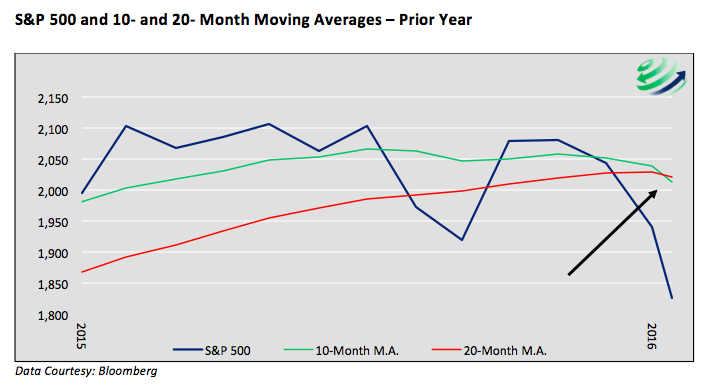
Important Disclosure: The moving averages shown above are based on the value of the index in late-February 2016. The crossing of the two moving averages will not be “official” until the end of the month. By our calculations, a closing price of 1993 or lower on the S&P 500 on February 29 would cause the 10-month moving average to drop below the 20-month moving average.
Summary
Some investors are pure technicians and only use technical analysis to allocate capital. Others disregard it entirely; swearing it off as voodoo. As chart patterns are merely a reflection of capital flows resulting from human decision making, we believe technical analysis offers useful insight and can be helpful in gaining further conviction around an investment idea.
If, by the end of February, there is indeed a crossover of the moving averages, we will have a higher level of confidence that the near-constant march higher in prices since 2009 has reversed trend. For that reason, we are keeping this stock market indicator on our radar. And if history proves prophetic, buckle up. Stock prices may be in for a precipitous decline.
More from Michael Lebowitz: “Agriculture: An Alternative Investment Worth Harvesting“
Twitter: @michaellebowitz
The author has a position in mentioned securities at the time of publication. Any opinions expressed herein are solely those of the author, and do not in any way represent the views or opinions of any other person or entity.


: Showing Some Signs of Emerging Strength")
