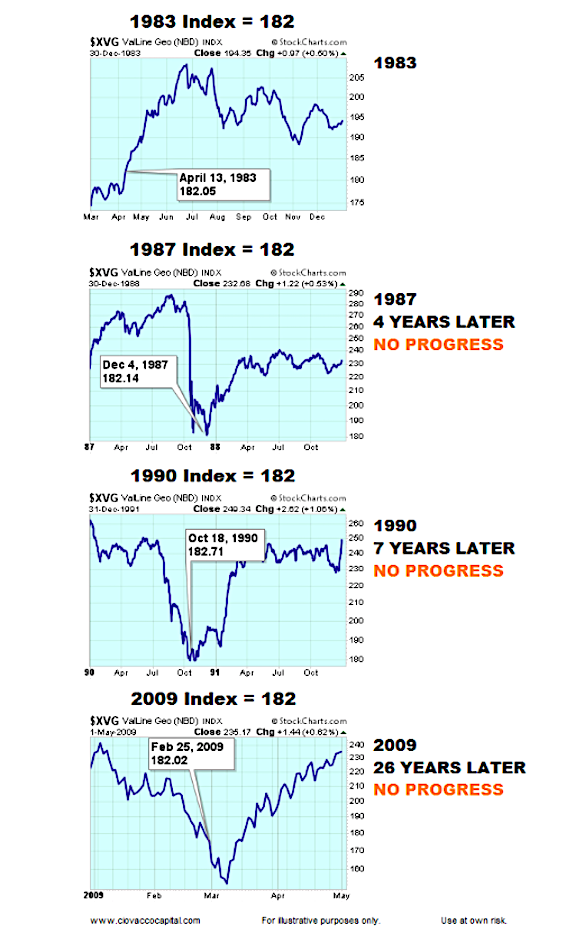
The Bottom Of The Box
The multiple decade range for stocks also had numerous visits to the bottom of the box. If we take a closer look at the Value Line Geometric Index in 1983, 1987, 1990, and 2009, it is easy to see the average stock went nowhere for 26 years. This means the average stock has been treading water (consolidating) for 26 years. The charts shown below represent the bottom of the 34-year consolidation box (1983-2017).
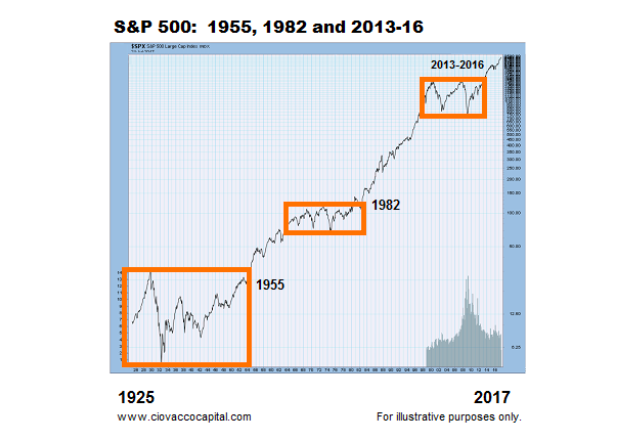
The Longer A Market Goes Sideways
As we noted on July 25, the expression “the market needs to consolidate its gains” applies to all timeframes, from 34 minutes to 34 years. As illustrated via the big move after the S&P 500’s breakout in 1982 (see chart below), the longer a market goes sideways, the bigger the move we can expect to get after a breakout or breakdown.
The same concept applies to the recent breakout attempt by the Value Line Geometric Index. The breakout also runs counter to the theory the markets are being pushed higher by a very short list of well-known stocks. The breakout below speaks to healthy market breadth/broad participation by a wide range of stocks. Fractals tell us to respect the recent breakout from a 34-year consolidation box.
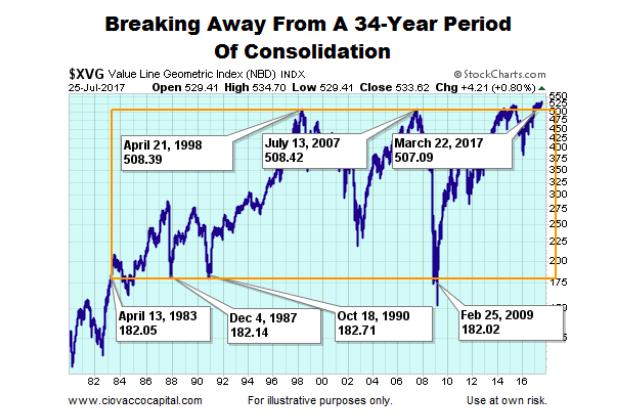
The longer the breakout holds, the more meaningful it becomes. Based on price action, the bias over the last seven months has been “the breakout looks like it is holding”. Time will tell and we will learn something either way (holds or another failed breakout).
Thanks for reading.
Twitter: @CiovaccoCapital
The author or his clients may hold positions in mentioned securities at the time of publication. Any opinions expressed herein are solely those of the author, and do not in any way represent the views or opinions of any other person or entity.


