When markets get hit as hard and as continuously as they did today, it’s a good idea to step back and look at the big picture.
Focus on the major swing levels of support.
Last week I highlighted the importance of measuring against the June lows. Now they are in play.
For XRT, it’s at the December 2018 low, which was also the same level as the 2015 and 2017 low!
IWM is closing in on an equally critical level – 145. This was an important swing low in 2017, 2018 (twice) and June 2019.
IYT has a similar level around 175.
So are we in for a major breakdown, or will the bullish charts prevail?
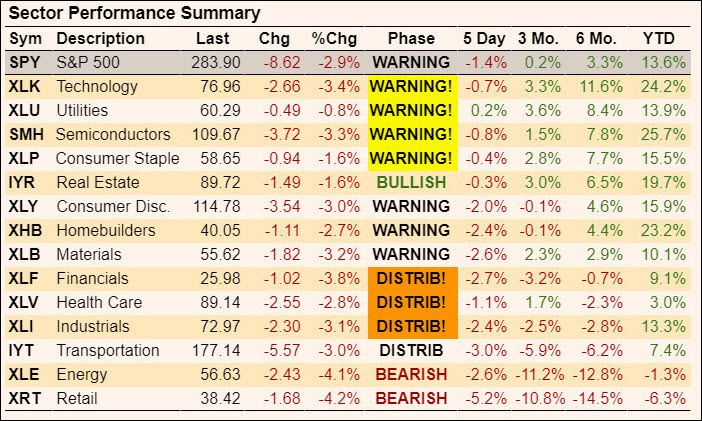
The last of the bullish phases (XLK, XLU, SMH, and XLP) all moved into warning phases.
There’s only one sector in a bullish phase in the sector summary table below, and it’s IYR which should be benefiting from the higher bond prices.
DATA TABLE
Even Utilities moved into a warning phase today!
However, in contrast, to the scary position of many of the major sectors, the SMH held yesterday’s low, and
The DIA, QQQ, and SPY have not broken their August lows, and the DIA is sitting on its 200 DMA.
While that doesn’t suggest that the market’s in good shape, it is still within levels of ‘sanity.’
‘Sanity’ may, however, be the problem.
There wasn’t any panic in today’s trading. It was a steady pressure of selling any little rally.
This, plus the fact that even defensive sectors were down, is very bearish. It’s a warning as glaring as today’s image that shows the top 4 performing sectors on a 6-month basis all slipped into a warning phase today.
That means they moved under their 50 DMA which is still above their 200 DMA.
If the QQQ, DIA and/or SPY break their August low use the 30-minute opening range to determine if the break is going to follow through or not. Don’t assume that it will.
However, IF these levels break, the markets are pointing towards more significant declines. Don’t fight it.
While the more popular expression is “there’s always a bull market somewhere,”I’d suggest for anyone looking at stocks that the we think in terms of “there’s always a bottom somewhere,”but it’s not clear that we’ve found it.
Finding the bull market is easy – Bonds.
One of the way’s I’ll be looking for the big bottom is with our Alpha Rotation System which has been in bonds for some time now.
Stocks will have their day. Be patient.
Important stock market ETF Levels:
Subscribers: Pivots negative in all
S&P 500 (SPY) Support at swing low, 281.72. Big support area is 280 to 277.70 (the 200 DMA). Resistance at 287.
Russell 2000 (IWM) Needs to hold June low of 145.30. Resistance around 147.50.
Dow (DIA) Closed under the 200 DMA. Swing low support levels are 254.36 and June low of 247.Resistance at 258.50 and then around 264.50.
Nasdaq (QQQ) Swing low is at a trendline from the December 2018 low. Resistance at 183.50 then 190.70.
KRE (Regional Banks) Broke June low. Support at today’s low, 48.65 then Dec. low, 44. Resistance around 50, then 51.50.
SMH (Semiconductors) Support at today’s low area, 109.00, then 108. Resistance at today’s high 11.50 then 114.19, then 116.
IYT (Transportation) Broke Aug. low, 179.25. June low support at 175. Resistance at 179 then 186 then 191.
IBB (Biotechnology) August low support at 101.43. Looks interesting if it can close over 107.
XRT (Retail) Next big support area is Dec. 2018 low which is also the low area from 2015, 2017, at 37.70 – 38.00 area. Major resistance around 41.50.
Twitter: @marketminute
The author may have a position in the mentioned securities at the time of publication. Any opinions expressed herein are solely those of the author, and do not in any way represent the views or opinions of any other person or entity.
: Creating Bullish Divergence?")


 and Semiconductors (SMH): Concerning Price Pattern?")


