 One by one, the large- to mega-cap leaders of this bull market have been taken behind the woodshed and shot. Names like Biogen Inc. (BIIB), Apple (AAPL) and Disney (DIS) are a few that come to mind. Former leaders like Baidu, Inc. (BIDU) and Green Mountain Coffee (GMCR) peaked in November 2014 and have been crushed. And late this week Tesla (TSLA) and newcomer Fitbit, Inc. (FIT) have taken it on the chin. Of course, many of these stocks have had great runs during this aging bull so a knockdown once in awhile is almost certain.
In retailing, and despite the strength in the Sector SPDR Consumer Discretionary ETF (XLY), stocks like Polo Ralph Lauren (RL), Coach (COH), Michael Kors (KORS) on the higher end and Wal-Mart (WMT) on the lower end have gotten pounded. A new and what seemed like can’t miss investment, the PureFunds ISE Cyber Security (HACK) ran up over 40% from its November 2014 start to its peak in June. Since then, the ETF is down over 13% in less than 2 months.
I have already discussed the underlying weakening in the market internals that has occurred over the past months as the generals (mega caps) keep rising and the troops (small/midcaps) keep dropping. The major indices are all market cap weighted and so far, the big names are holding up an ever heavier market. But, when the generals start to top, there will be little to hold these indices up. The matchsticks (mega caps) are slowly snapping and this is very reminiscent of major highs back through history. If you are lucky enough to be in the favored few, you are doing great and not feeling the pain of so many others. However, there seems to a land mine around every corner.
Fellow SIM contributor and quant extraordinaire Ryan Detrick assembled some interesting stats the other day showing how bifurcated the stock market was. The largest 98 stocks by market cap stocks in the S&P 500 are up an average 6.6% this year while the second hundred (99) are up 5.4% in 2015. The smallest 100 (97) in the index are down an average 6.6% this year. He also showed that 68% of the largest stocks in the “500” are up in 2015, while only 39% of the smallest stocks in the “500” are higher this year.
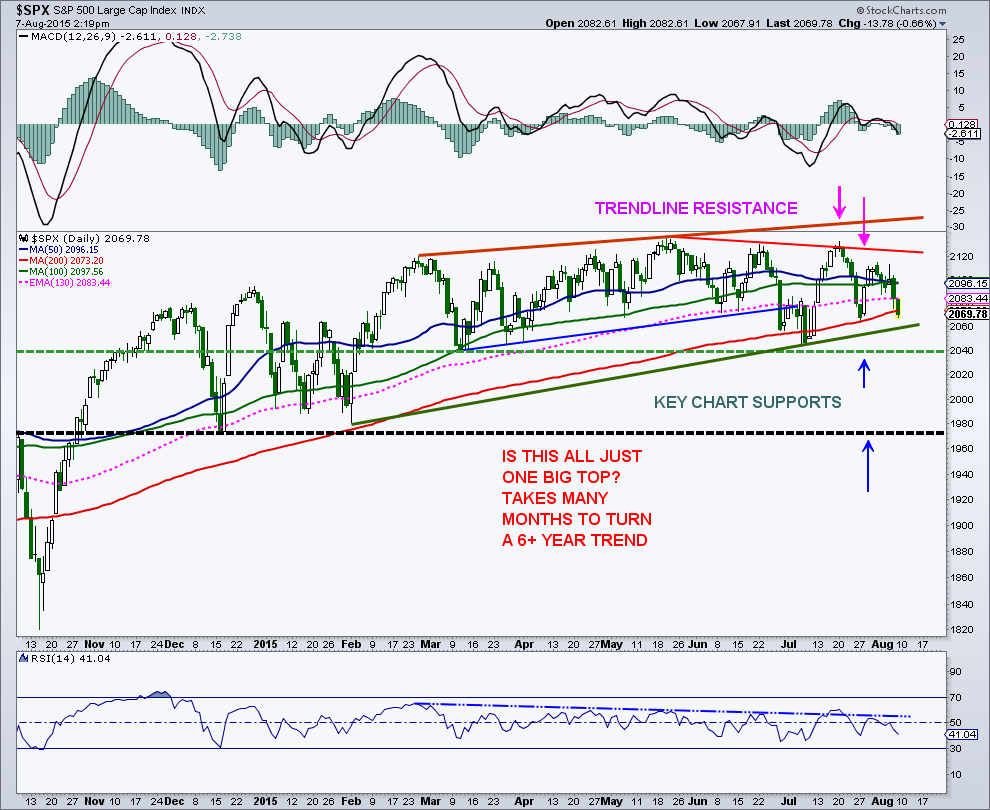
This has been a market with absolutely no follow through on the upside and the downside. Looking at market tops historically, this is very typical. The market has transformed into a buy-the-dip (BTD) and sell-the-rip (STR) market, from a BTD market. Certainly a character change is present. Stock market tops take time as institutions need months to distribute stocks that have gone up for over six years. Longer term trends rarely turn on a dime, but seduce you into thinking this is just another bullish consolidation. During the 2000 peak for the S&P 500, the index basically went sideways for a year before finally breaking down. An investor or analyst can become very complacent during the topping phase as they have been rewarded over and over to ride the swings out before another new high is made.
This could very well be happening again. The S&P 500 has literally gone nowhere since it’s early December 2014 high near 2,080. From a price perspective, this still could be a bullish consolidation. I doubt it, but will keep an open mind with an eye on the 2,040 area on the S&P 500.
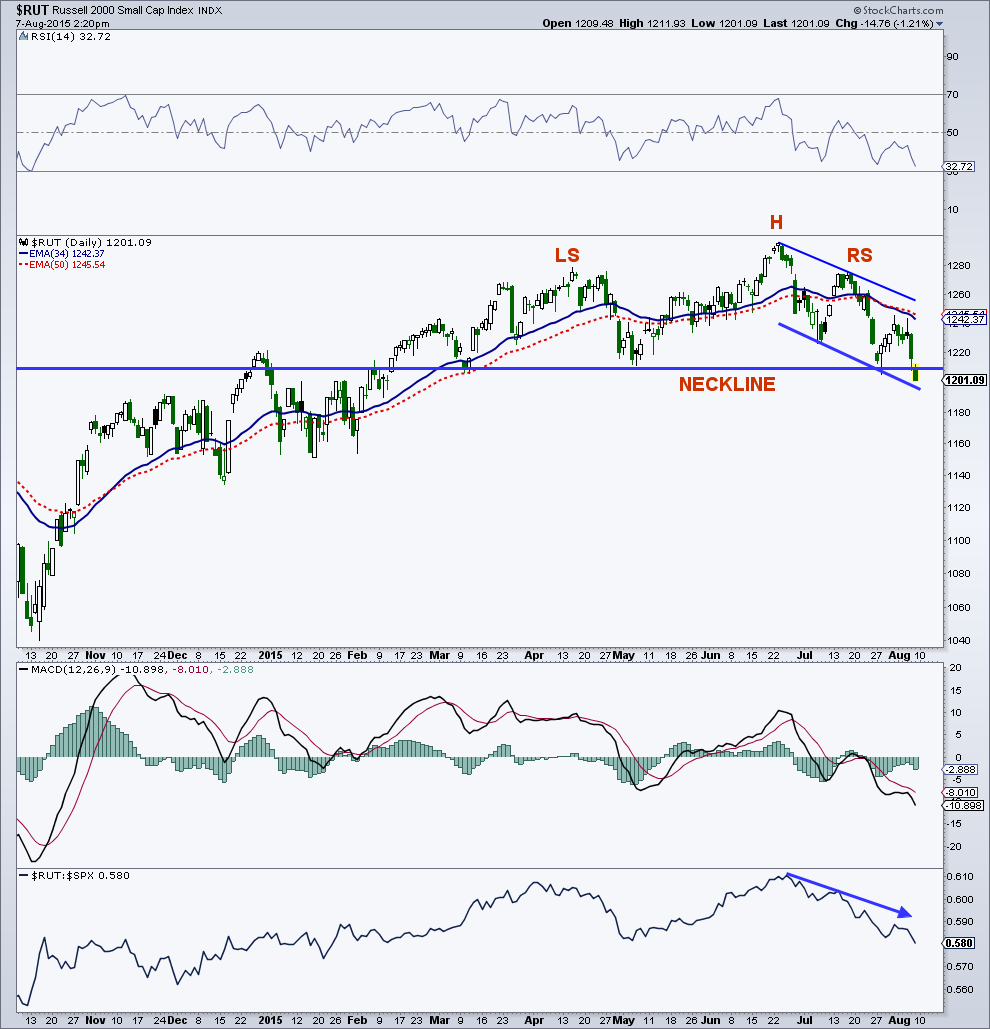
The Russell 2000 is the closest index to breaking down and completing a decent sized top. The Russell 2000 has traced out a two lower highs and appears to be making a second lower low right now. More importantly, prices are sitting right on the neckline of a potential head-and-shoulders (H&S) top at 1209. If the 1,209 level is busted cleanly, there could be a measured move, based on the size of the H&S pattern, of 87 points, which would potentially lead to a decline down to 1,122, or a 7.2% decline from the neckline. Relative strength of the “2000” vs. the “500” peaked on June 25 and has been sliding lower ever since.
The only major index to reach a new high recently has been the NASDAQ 100. The QQQ’s (ETF) broke out in mid-July but have since dropped back to just below their breakout area of 111. At many tops, there is one index that is last to peak and this one has certainly been helped by some of the mega cap favorites in technology and biotechnology. To complete at least a small top, the QQQ’s will have to take out the bottom of the recent range at 106 to open the door for any kind of real weakness.
The stock market has not yet progressed to one where you can start shorting the rips and not buying the dips, but it is getting closer. Have a great weekend.
Twitter: @MarkArbeter
The author does not have a position in any mentioned securities at the time of publication. Any opinions expressed herein are solely those of the author, and do not in any way represent the views or opinions of any other person or entity.


: Showing Some Signs of Emerging Strength")
