One of the most recurring questions of late has been how the stock market can be within a stone’s throw of previous highs in the midst of a deep global recession triggered by a pandemic.
Measuring from January 1, 2020, the S&P 500 Index and TSX Composite are down only 1% and 8%, respectively.
This is in the face of the grimmest economic backdrop since the great depression.
The unemployment rate in both the United States and Canada is a little over 12% and our economies are expected to contract by 5.6% & 7.0%, respectively. This has many exulting: “the stock market is not the economy.”
As with everything in this day and age, there is some truth and some falsity to that claim.
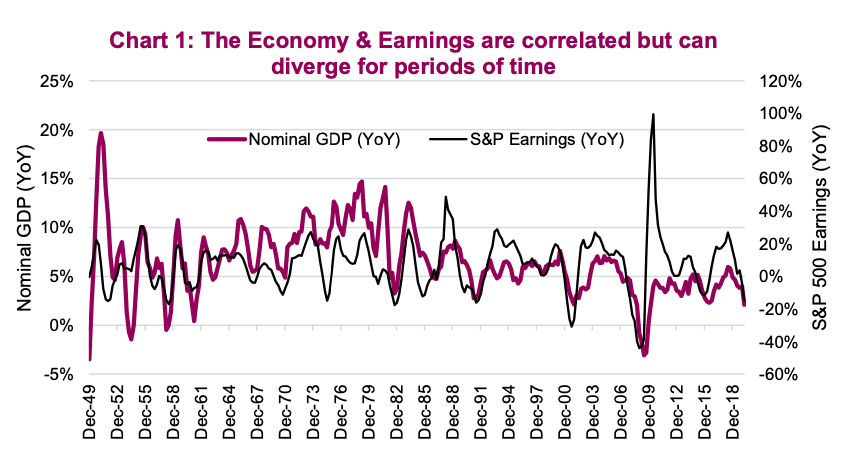
Over time, the economy and the stock market’s earnings have a strong positive relationship. Although it’s worth noting that S&P 500 corporate earnings swing with a greater magnitude than the economy as companies often use leverage in their capital structure and have greater reliance on corporate spending than the consumer.
The price or index level of the market is further distorted by changes in what investors are willing to pay for earnings, i.e. the market multiple. Add all this up and there are periods when the economy and stock market appear to be marching to two different drums. This can persist for months, quarters and even years – but it doesn’t last.
There are a number of factors that have been feeding this recent divergence between the market and the economy. Some of this may be structural in nature, potentially causing the magnitude and duration of the divergence to be more substantial.
Market Composition Has Changed Substantially
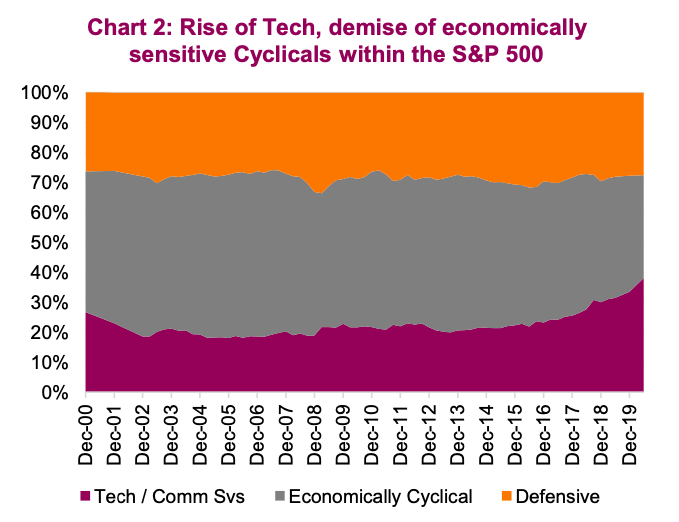
One of the big contributors to this “market versus economic divergence” is that the make-up of the index constituents has migrated from a diverse mix of industries in the first decade of the century to one that is dominated by technology firms. In the last 20 years, the technology weight has increased to 25.4%.
The only other sector that has had a material proportionate increase has been the Communications services sector, increasing 7.3% over the past 20 years. But don’t be fooled – that actually constitutes technology as well. In 2018, index provider Standard and Poor’s switched the telecommunications sector to communication services and moved Facebook and Google there from technology.
These two former technology companies now account for roughly 50% of the communication services sector. So together, tech plus communication services, less legacy teclos, accounts for about 36% of the S&P 500
index. Meanwhile, the more economically sensitive sectors such as Energy, Materials, Industrials and Consumer Discretionary have seen their weight in the S&P 500 index fall over recent years (Chart 2).
Secondly, we have evolved over the decades from a manufacturing -based economy to a service-based economy. A large percentage of major industrial corporations are publicly traded, whereas the service sector is disproportionately not represented in the S&P 500 because your “mom and pop” businesses, gyms, restaurants and salons, aren’t publicly traded. Unfortunately, this has been the part of the economy hardest hit by the shutdowns. Whereas the five largest companies in the index – Microsoft, Apple, Amazon, Facebook and Google – have actually thrived from the stay-at-home economy.
Most technology firms have a relatively small workforce of highly skilled experts. This only adds to the problem of the top 1% of income earners further pulling away from the median income. Statistics Canada states that businesses with 1-499 employees account for 87% of employment in our country, truly the lifeblood of our economy. Only 13 companies on the S&P TSX have less than 500 employees. The dichotomy is not quite as wide in the U.S., where firms of 500 employees or more account for more than half of employment.
And then there are the quants
Another structural change that has contributed to periods of divergence between the market and the economy has been the rise of “the quants”, both in number and capital allocated to these strategies. Quantitative investing generally refers to strategies based on algorithms or rules- based models that can be complex or even rather simple, designed to profit from opportunities in the marketplace.
Momentum, risk parity and our own risk-on/risk-off tactical strategy are a few of many strategies utilized in the quant world. While the diversity of strategies is large, there are times when the majority of these strategies are selling or buying simultaneously. This can create or accelerate price changes in the market, which we believe has occurred in recent months.
It’s difficult to determine precisely when this occurs as visibility into many of these strategies is obscured. However, a popular tool among quants is the S&P 500 E-mini futures contract, used as a tool to gain market exposure or reduce market exposure. This provides a partial picture of the aggregate direction of trading for this cohort of the market.
Starting in late February, the net positioning of these futures went from about neutral – meaning there were about as many long open contracts as short open contracts – to a near record short position over the subsequent six weeks. These bearish bets on the market were of the same magnitude seen in the 2015 correction, 2011 European debt crisis and 2008 Global Financial Crisis. This puts added downward pressure on the market and likely accelerated the declines witnessed in February/March (Chart 3).
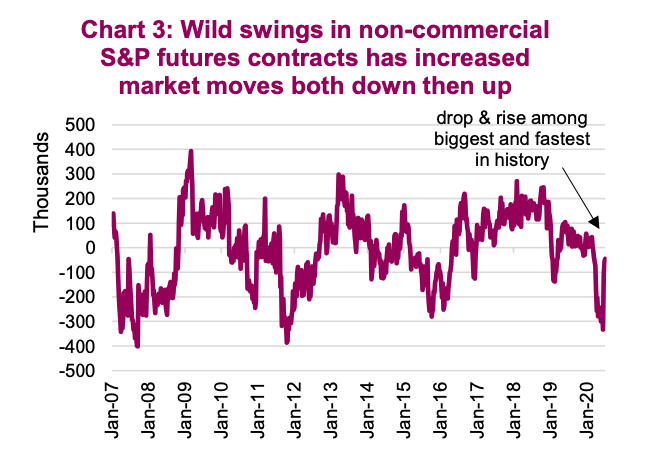
However, in the past few weeks, this has reversed faster than ever, putting upward pressure on the market. This has likely helped the market weather the negative news on the pandemic and other macro risks. Or helped the equity market diverge even further from the economic environment. The question now becomes whether a more neutral stance may slow this upward pressure on the market. This also raises the possibility that the market may start paying more attention to the macro news.
Source: All charts are sourced to Bloomberg L.P. and Richardson GMP unless otherwise stated.
Twitter: @ConnectedWealth
Any opinions expressed herein are solely those of the authors, and do not in any way represent the views or opinions of any other person or entity.

: Showing Some Signs of Emerging Strength")
