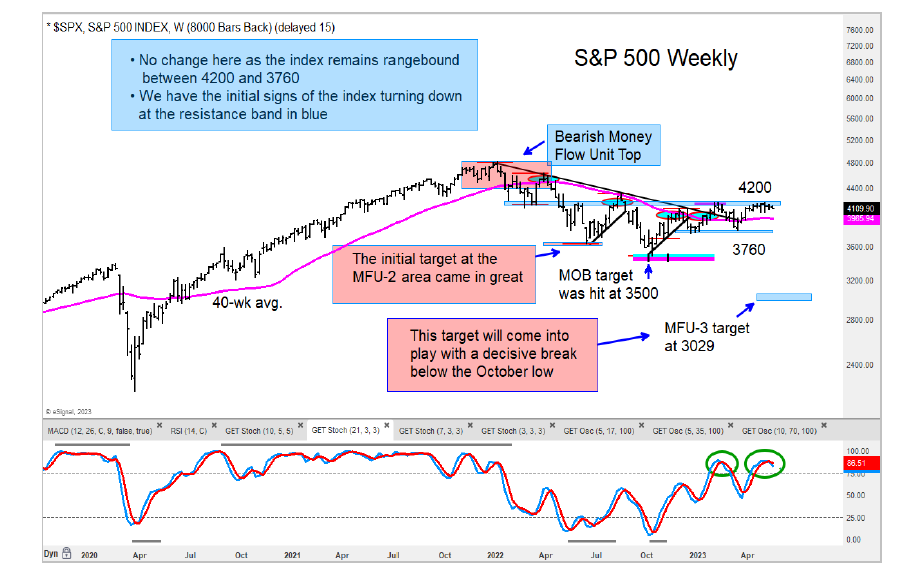
The S&P 500 Index reached important price resistance near 4200 and has turned down. Could this be an indication that “sell in May” is on the table this year?
When looking at the percentage of stocks in the S&P 1500 with a positive and negative multi-factor technical model score, I found a narrowing number of stocks with a positive score. And that is both concerning and bearish.
The weakness in the market internals reminds me of the classic block stacking game Jenga where the blocks are slowly pulled one after another until the final one pulls the remaining blocks crashing down. I am not calling a crash, but looking at so many weak scoring stocks on a weekly time frame, we see these stocks as silent crashers.
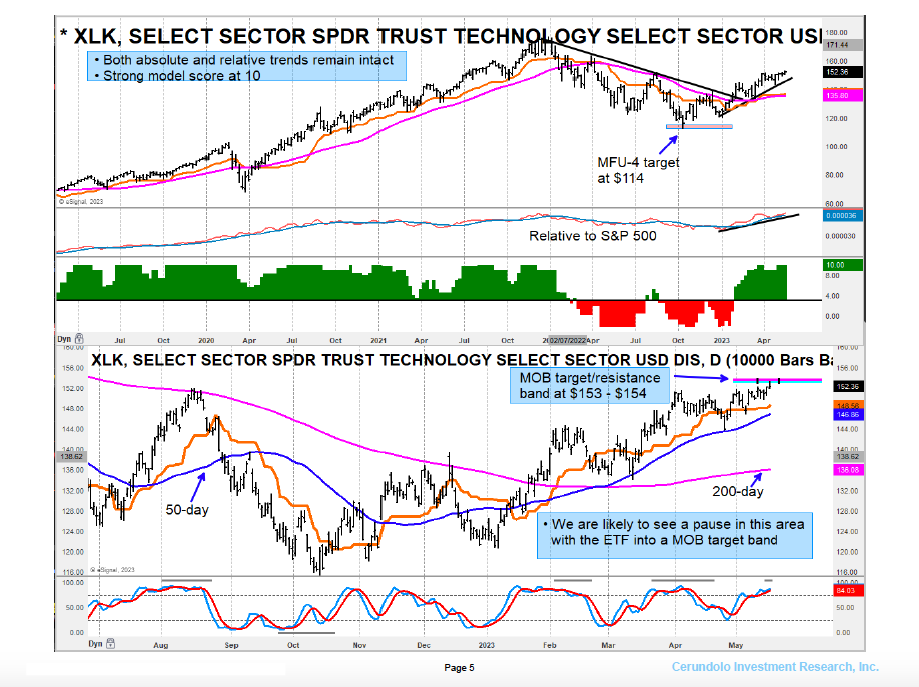
I also think that it is important to monitor the relative strength fo the eleven S&P 500 sector ETFs on weekly and daily charts. This is a good way to highlight what is going on beneath the surface of the marker versus focusing on the many indices out there. Several are lagging and poor performing. Below is a chart of the Technology Sector (XLK), one of the few that are out-performing.
In summary, the sell-in-May and go-away scenario may be at hand.
S&P 500 Index Chart
$XLK Technology Sector ETF Chart
Twitter: @GuyCerundolo
The author or his firm have a position in mentioned securities at the time of publication. Any opinions expressed herein are solely those of the author, and do not in any way represent the views or opinions of any other person or entity.
: All Energy Hands on Deck!")


: All Energy Hands on Deck!")