 As stocks in Germany and China try to work through major stock market corrections, the U.S. market and select sectors look pretty good.
Market sentiment is amazing these days and seems to be driving the markets. The Fed Statement lit a fire under the market (just as it did in March) and gutted “The Fed must raise rates now” crowd.
Be sure to read this week’s “Top Trading Links” for a full primer on sentiment.
GLOBAL MACRO
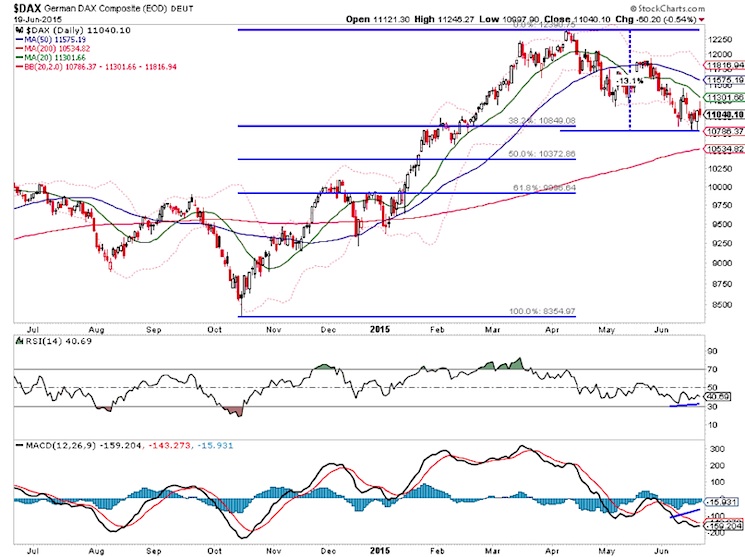
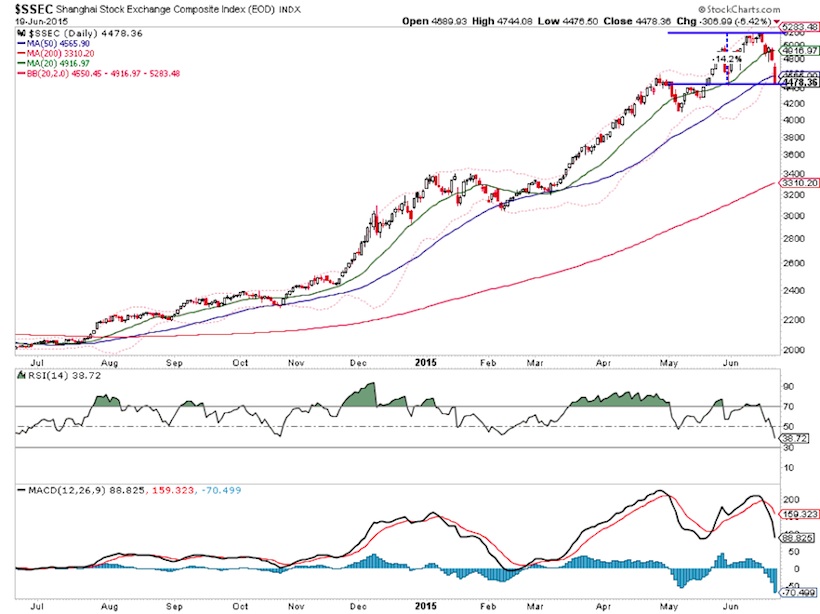
Germany is in correction land, with the German DAX roughly 10% off its highs. Meanwhile the Shanghai Composite is 14% off its highs. Those stock markets have been feeling some pain of late.
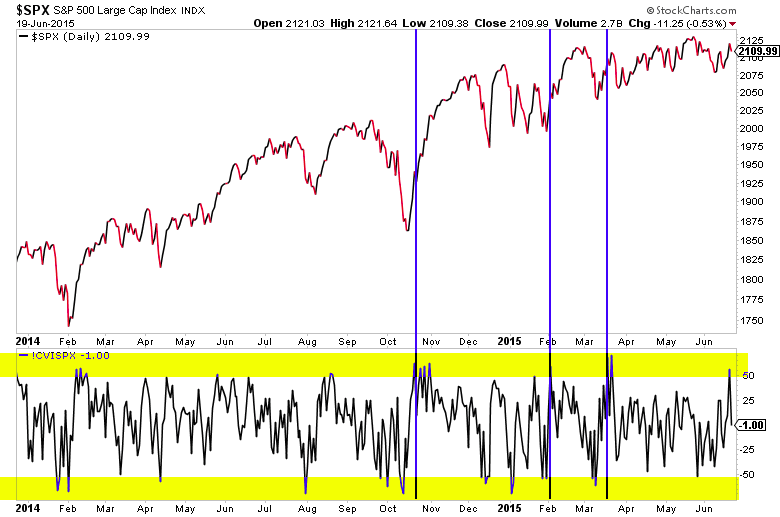
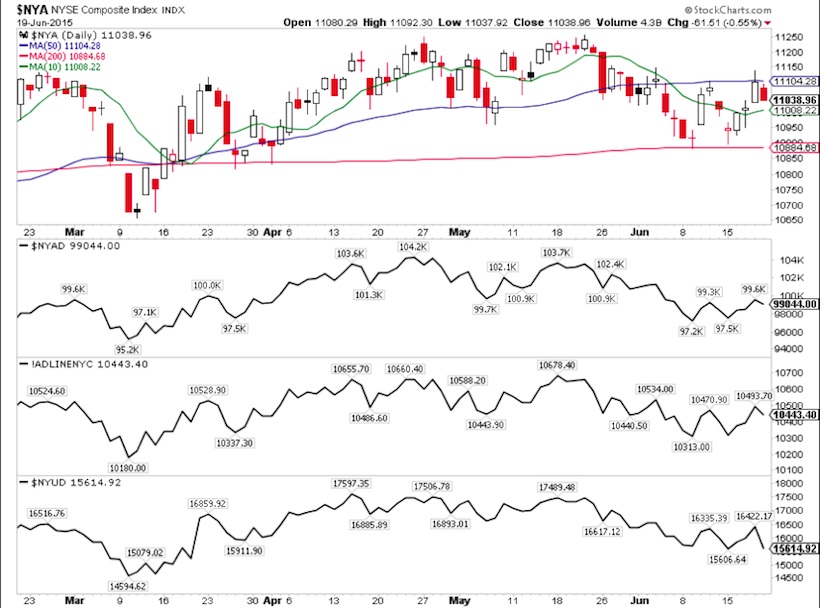
Then there’s the major U.S. stock market indices holding at or near all time highs. We could say that’s a sign of relative strength, but the U.S. markets have done their own thing thus far in 2015.
The S&P 500 had trouble closing and holding above 2120 once again – that is the level to watch. The technical summary: resistance in the 2120’s, support in the 2060’s
As well, the market saw it’s sharpest buying pressure since the last FOMC press conference.
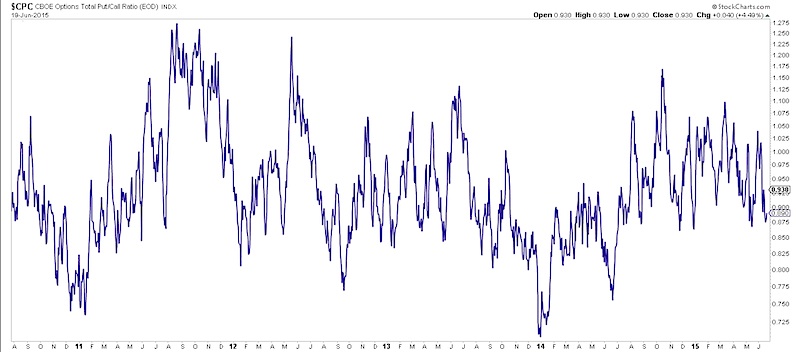
Check out the Put-Call Ratio – it’s drifted lower in a toppy looking range.
Stock market breadth is still pretty much holding in-line with price.
Sector And Select Markets
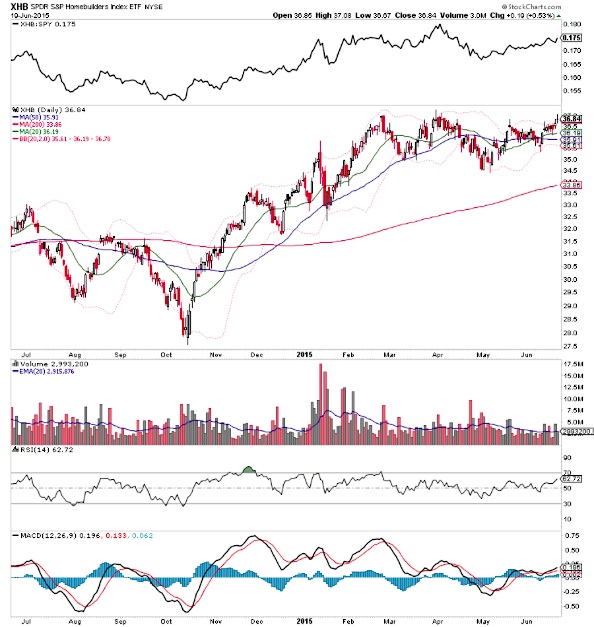
The Homebuilders ETF (XHB) stood out Friday. They’re at a key point, trying to break out of a multi-month base
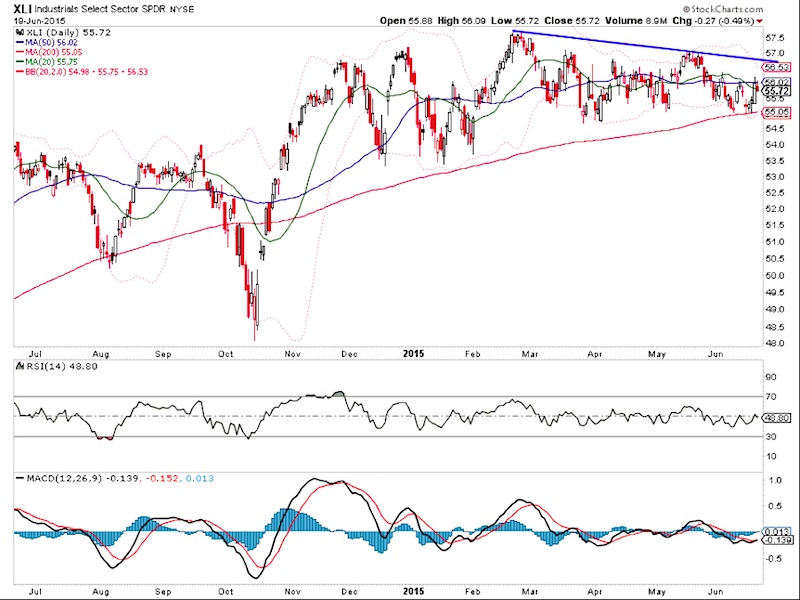
The Industrials Sector ETF (XLI) has consolidated for months and recently touched the 200 day moving average. If this sector is going to rally, now is the time.
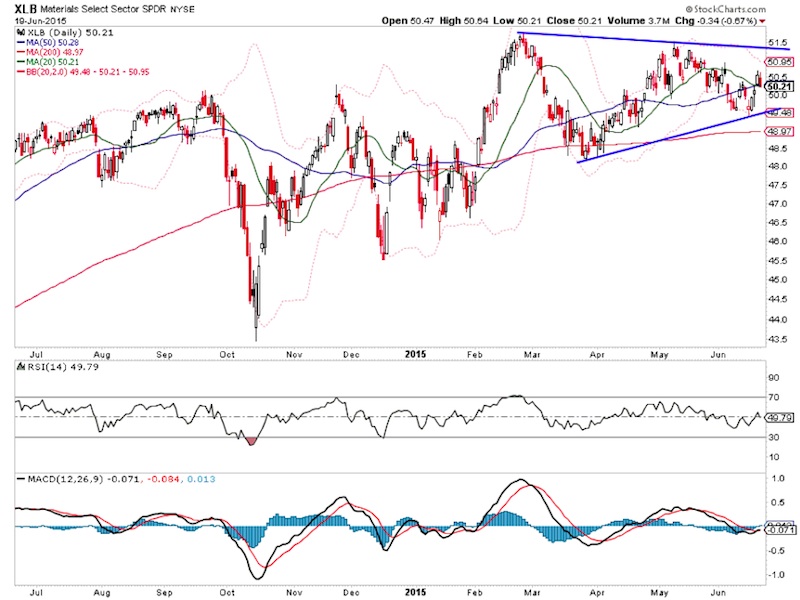
The Materials Sector ETF (XLB) has formed a symmetrical triangle near its all time highs. Some materials names that stand out include Dow Chemical (DOW), Ecolab (ECL), and Vulcan Materials (VMC).
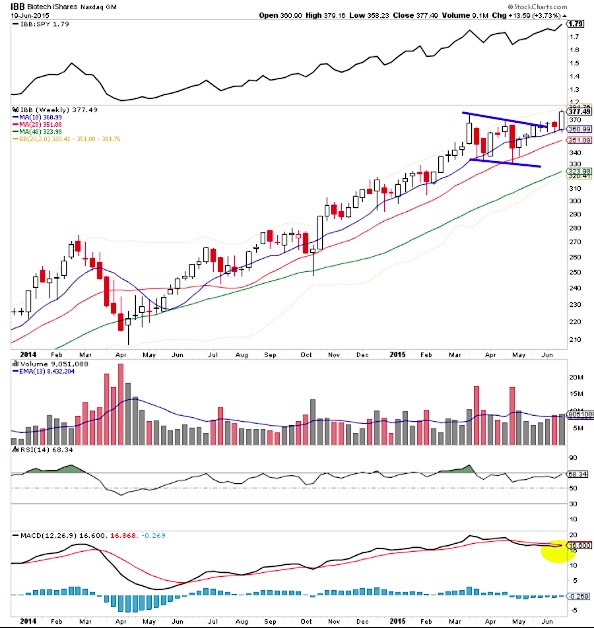
The Biotech Sector ETF (IBB) broke out of a month long consolidation to new highs. We’ll be watching for follow through.
As well, check out this seasonality chart from EquityClock.

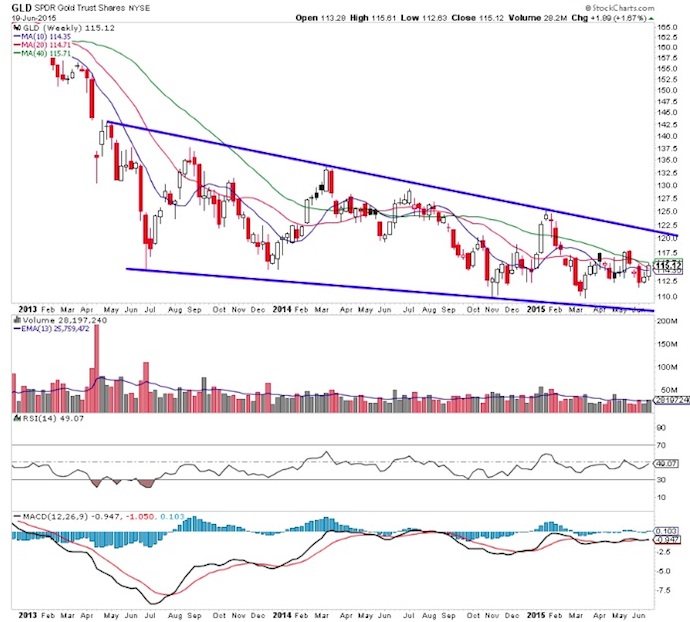
Gold (GLD) ran to its 40 week moving average. The broader structure for Gold is very interesting and will eventually lead to a monster move… but the direction yet to be determined. The waiting is the hardest part – patience!
Additional Market Thoughts
Looking around the world, the markets are a bit messy. China ramped (thanks to the government pulling 3 levers a week to increase/open up investment), then felt some pain. The European stock markets are finding its way and Emerging markets are for pickers. Really not that great of an investing environment in general. That said, the U.S. could be the main beneficiary in the second half of the year if trends hold.
Thanks for reading.
Twitter: @ATMcharts
Read more from Aaron on his blog.
No position in any of the mentioned securities at the time of publication. Any opinions expressed herein are solely those of the author, and do not in any way represent the views or opinions of any other person or entity.
: Creating Bullish Divergence?")


 and Semiconductors (SMH): Concerning Price Pattern?")


