Greece and China are driving the risk-off nature in global markets. Naturally, we want to try to take advantage of the opportunities the market gives us. Looking around at my favorite investment ideas, some are reaching buy areas like the 10 week moving average. Overall, though, it just seems like the market is starting to unwind and needs time after large breakdowns across various groups. Time will tell on that front.
At the same time, MACRO trades are starting to work well and that seems to be an emerging theme for Q3. The economically sensitive groups continue to trade very poorly. This is a big concern regardless of Greece, China, Puerto Rico or whatever follows in global markets.
For more research on the markets, be sure to check out my latest weekend link-fest: Top Trading Links: Tis The Season For Market Volatility.
Market Backdrop
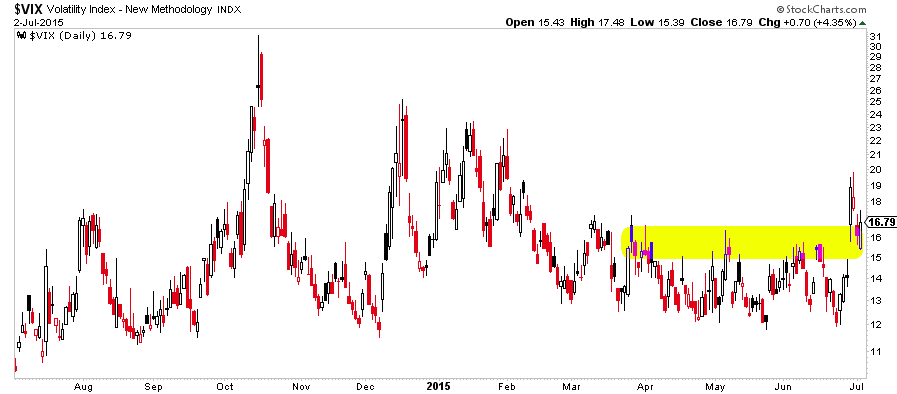
The Volatility Index (VIX) broke a key pivot area and held above it at the end of the week. This is worth watching, especially early in the week with the global markets reaction to Greece.
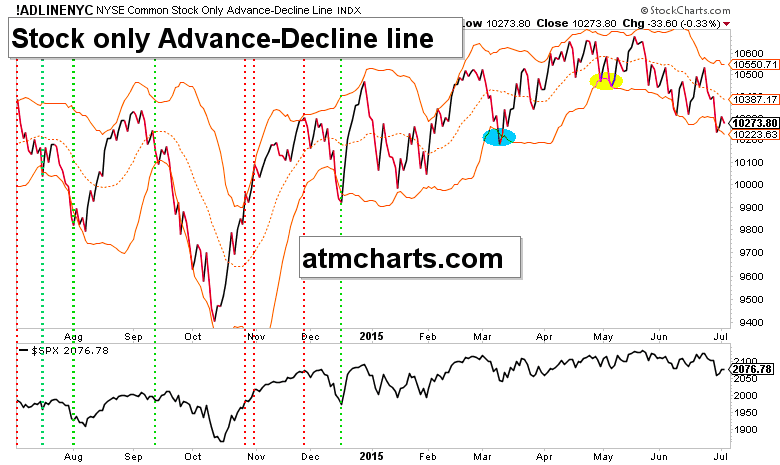
Market breadth remains weak. The Stock Only Advance-Decline line is starting to bounce off a level that has led to bottoms before… but the bounce has been weak thus far. Will declining market breadth lead to a tradable bottom?
U.S. Sectors
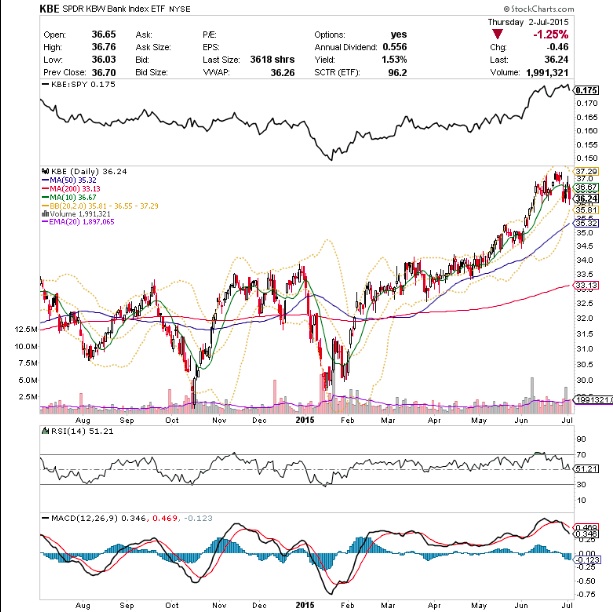
Banks are an important part of the market… Is this a head and shoulders top in the Bank Index ETF (KBE)?
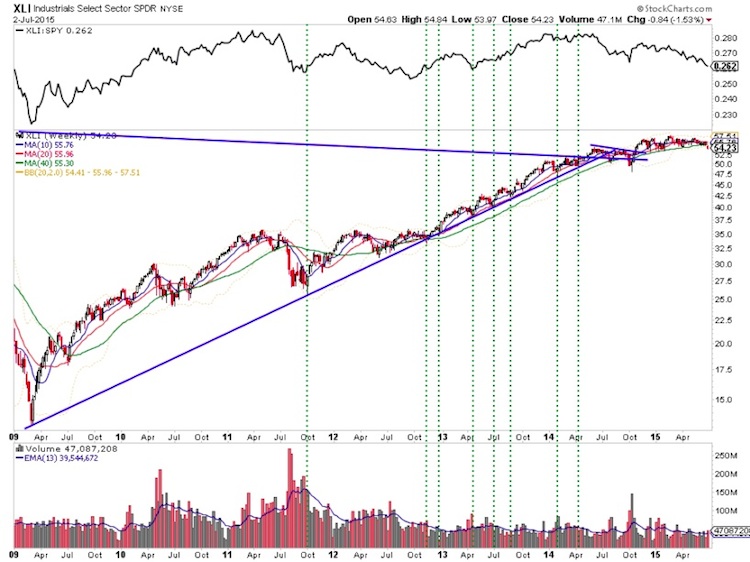
The Industrials (XLI) have broken a 7-8 month wedge lower while losing the 40 week moving average. Note that there is still a strong band of horizontal support down to about 53.
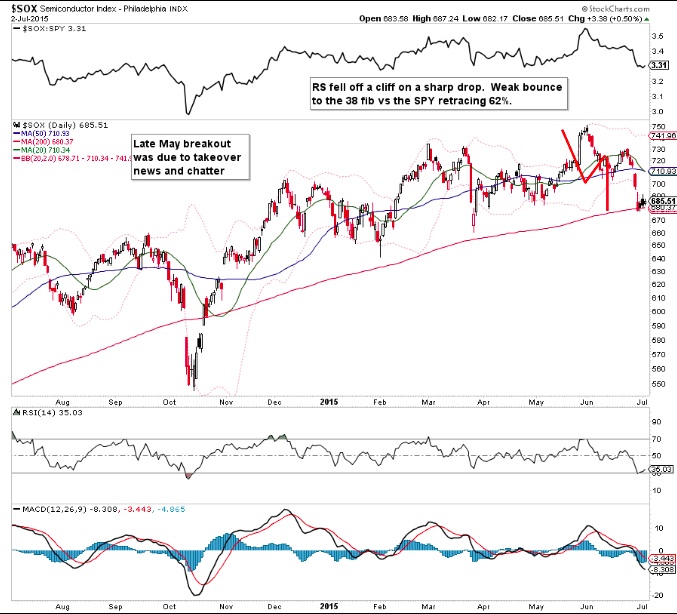
Since the M&A climax top in May, the Semiconductors Index (SOX) have traded with weakness. That continues with a weak bounce off the 200 day moving average.
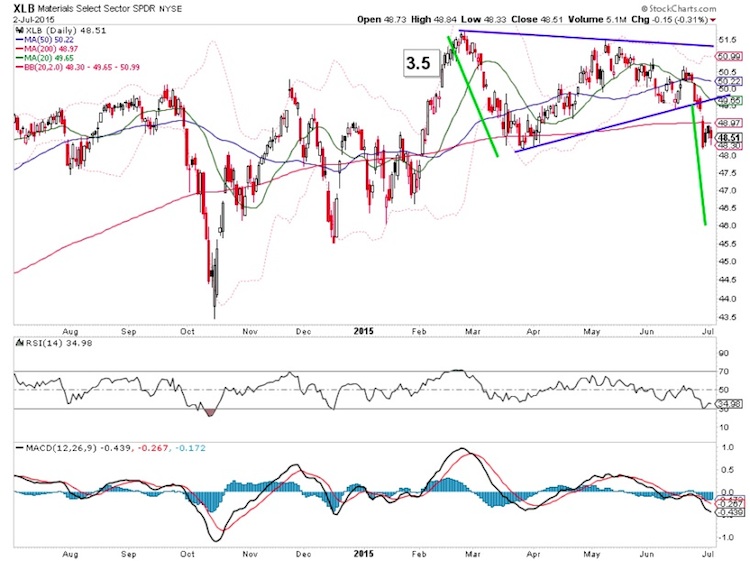
The Materials Sector ETF (XLB) broke down out of a symmetrical triangle. Normally, we’d bet on a trend continuation (higher). Clearly that’s not the case and worth noting. This chart has a ways to go to meet the measured move in the 46’s.
Other Markets
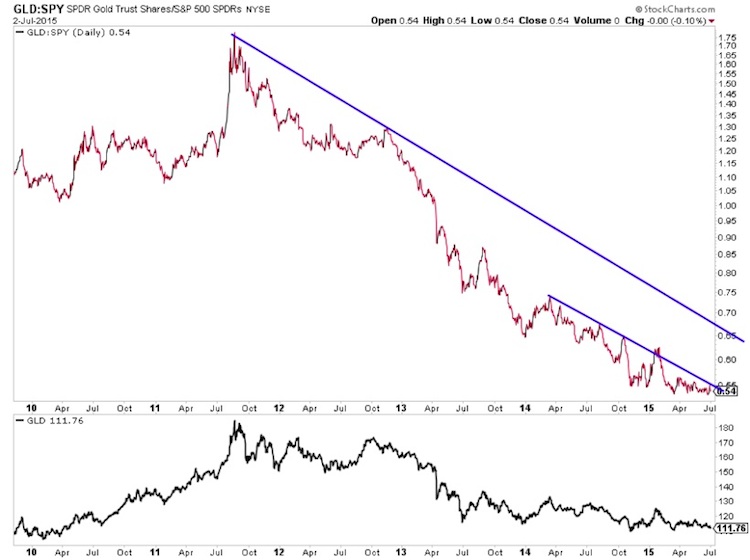
Gold (GLD) relative to the S&P 500 has traded in a tight range for some time. Is a big move coming soon?
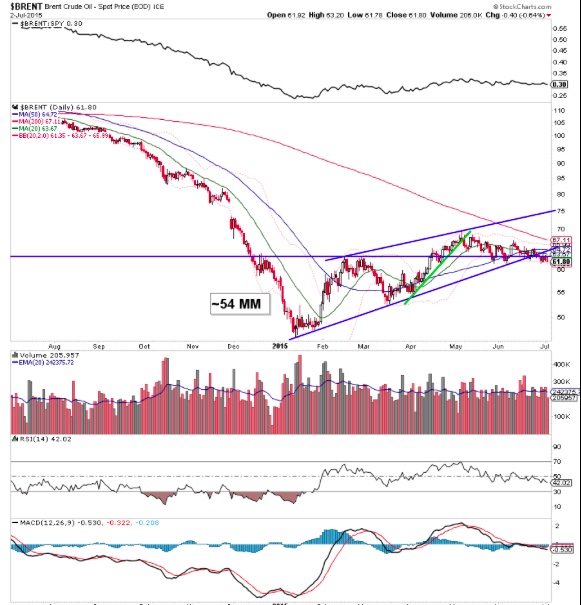
Brent Oil continues work lower after falling out of the rising channel. Now WTI has joined Brent in breaking down out of a double top. I looked at Crude Oil and the energy sector last week. In short, it’s not looking good at all.
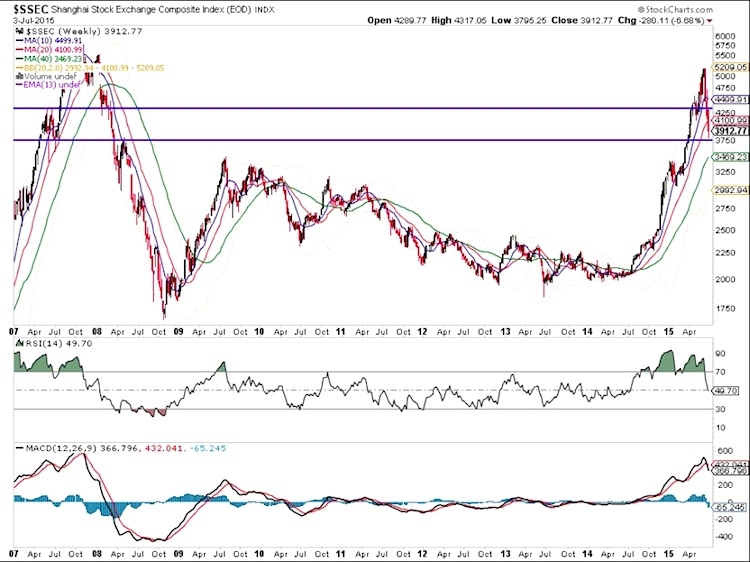
The Shanghai Composite (SSEC) is now 30% off the highs and testing a key pivot level into next week.
Trade safe this week and thanks for reading.
Twitter: @ATMcharts
Read more from Aaron on his blog.
No position in any of the mentioned securities at the time of publication. Any opinions expressed herein are solely those of the author, and do not in any way represent the views or opinions of any other person or entity.
: Creating Bullish Divergence?")


 and Semiconductors (SMH): Concerning Price Pattern?")


