Stock market futures are bouncing after losing support. The battle has not yet been won by buyers; clearly in a struggle to recapture important ground.
Today, S&P 500 futures (ES_F) are in a fight to capture 2055. Above there and buyers regain courage to advance, but so far sellers are in charge. The bigger cycles and market structures show that stock market futures continue to drift into lower support levels still.
Short term support is now near the 2032.75 mark; and resistance near 2055.5. Momentum readings are negative but lifting – that means we watch for bounces if short, or higher lows. Steep pullbacks remain buy zones. Lower highs and lower lows are holding in the drift to deeper support.
Shorter time frame momentum indicators for S&P 500 futures are negative and lifting, and higher than Wednesday. Longer cycles are downward trending, divergent, but slipping into neutral territory.
See today’s economic calendar with a rundown of releases.
Be sure to visit me TONIGHT with @Schwab4Traders – you can register here.
RANGE OF THURSDAY’S MOTION
Crude Oil (CL_F)
After a big bounce at the EIA release, the charts resumed the move down. Support sits at 36.6 still, while resistance lies near 39. For an intraday trading formation, we see a range event between 36.9 and 37.55, noting that momentum and trend are bearish, but still trying to reverse. Above a 37.55 retest sends us near 37.7, then 38.3 and 38.6. Below a 36.9 retest sends us to 36.87, 36.68 and perhaps 36.38, and 35.94. Crude continues to follow its own path, regardless of the direction stock market futures. Momentum on short time frames is negative but rising.
E-mini S&P Futures (ES_F)
Chart With Active S&P 500 Trading Levels (it’s been the same chart for some time due to rangebound market)
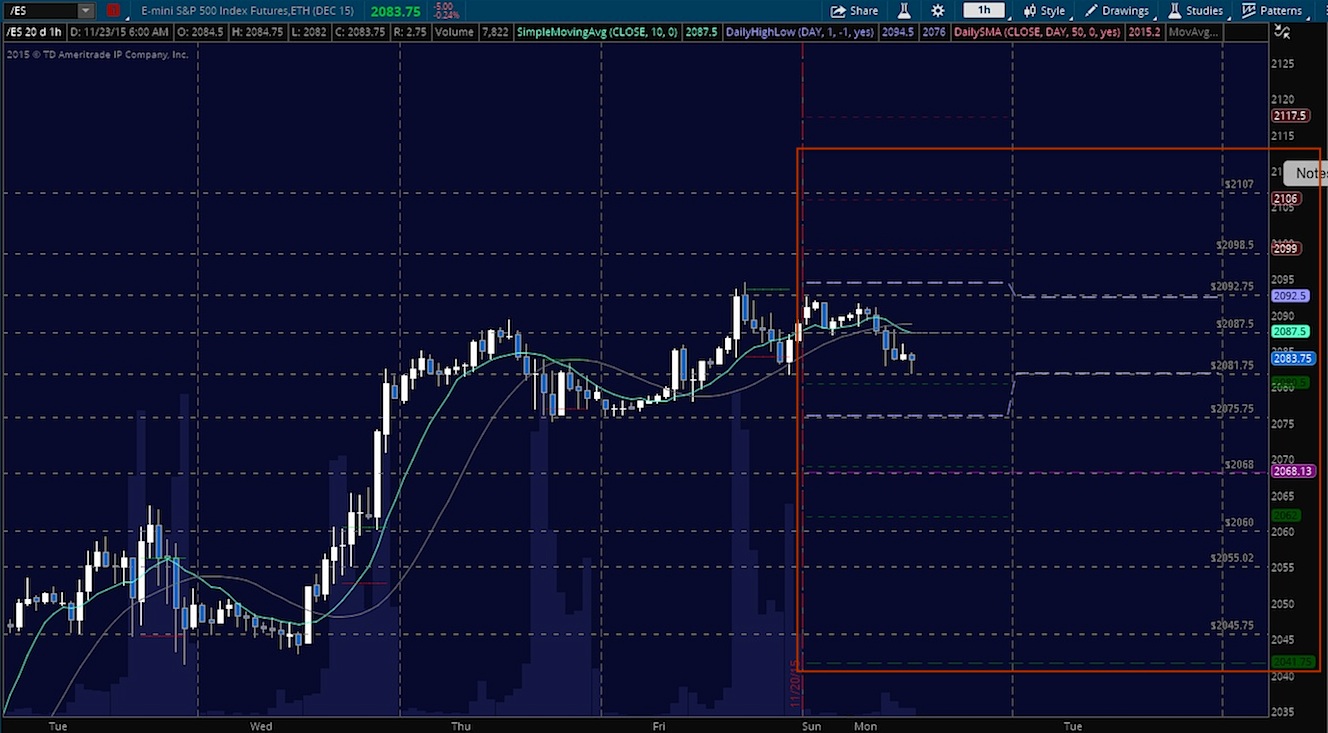
Upside motion for S&P 500 futures is best setup on the bounce off the support line near 2045, or a retest of 2051 after a breakout. A hold of 2046 should deliver 2048.25, 2051, then 2053.25, 2055.75, 2057, 2059. Again, another countertrend setup with the prevailing negative momentum. Keep an eye out for that.
Downside motion below the failed retest of 2045, or at the failure to hold 2050 opens a short (watch momentum on tight time frames- that would be an aggressive short). Retracement into lower levels from 2050 gives us the targets at 2048.25, 2045.5, 2041.75, then 2038.25, 2036.5, and 2034.25.
As long as a trader keeps himself aware of key support and resistance levels on stock market futures, risk can be very adequately managed to play in either direction as bottom picking remains a behavior pattern that is developing with value buyers and speculative traders.
Twitter: @AnneMarieTrades
Any opinions expressed herein are solely those of the author, and do not in any way represent the views or opinions of any other person or entity.

 Flirting With Critical Support… Again")


