Good morning and happy Friday. Time to look at some important S&P 500 levels and analyze the current price action.
A bounce off yesterday afternoon lows sends us into the current congestion zones at this time in the premarket. Formations are still bullish but weak so I expect another failed rejection of S&P 500 resistance and a drift into support zones below.
A breach of S&P 500 resistance at 2089.75 still projects us up into 2097 and perhaps 2100 – but so far 2089 is holding as resistance. A loss of S&P 500 support at 2076 allows for a test of 2068, where more buyers should expect a value event.
2 key S&P 500 levels: Near-term support now lies beneath near 2076 region and near term resistance near 2089 region. Breaches are likely to retest before continuing due to damp momentum readings.
Shorter-term time frame momentum indicators are bullish, and higher still than yesterday’s. Longer cycles are flattening, and in upward trending territory. All indicators at this point show buyers in charge, but their strength is not aggressive.
Click here for an economic calendar with a rundown of releases.
RANGE OF FRIDAY’S MOTION
CL_F (Crude Oil Futures) – The chart is now in a descending triangle, with some measure of bullish momentum still showing. The critical region that needs to holds for buyers is 41.25-41.4 – oil clearing is still facing headwinds.
We begin our 6th day in a very congested zone – something is going to give soon.
The breakout region remains 42.67 for the upside and 41.25 for the downside. Breakout above 42.67 sends us near 42.9 to 43.3, and perhaps into 44. Breakdown below 41.24 sends us near 40.79 to 40.24, and perhaps into 39.9 and 38.47.
Momentum on short time frames still mixed. See premium blog for tighter levels.
ES_F (S&P 500 Futures) – Upside motion is best setup on the bounce off the support line near 2082.5. If the buyers have limited power, the chart will fail to breach and hold 2089.75. This is the same setup as yesterday due to the channel formation. Momentum is fairly bullish but feels tentative, so trailing stops are good strategies in spaces that charts could fail quickly. A hold of 2082.5 should deliver 2084.75, 2087.25, if it holds over 2089.75 – then 2091.5, 2094.25, and potentially 2097.25, and 2100.25 as S&P 500 levels and targets.
Downside motion below the failed retest of 2080, or at the failure to hold 2087.75 (watch momentum- that would be aggressive ) opens a short. Short trades should be staged into support and then cautiously watched after some profit is taken, until we fail 2045 on a retest- that level represents a very strong buying support zone and will keep the chart essentially bullish.
Buyers are still clearly in charge, though patterns look very tired. Retracement into lower S&P 500 levels from 2080 give us the targets at 2077.5, then 2075.75, 2071.5, 2067.75, 2065.75
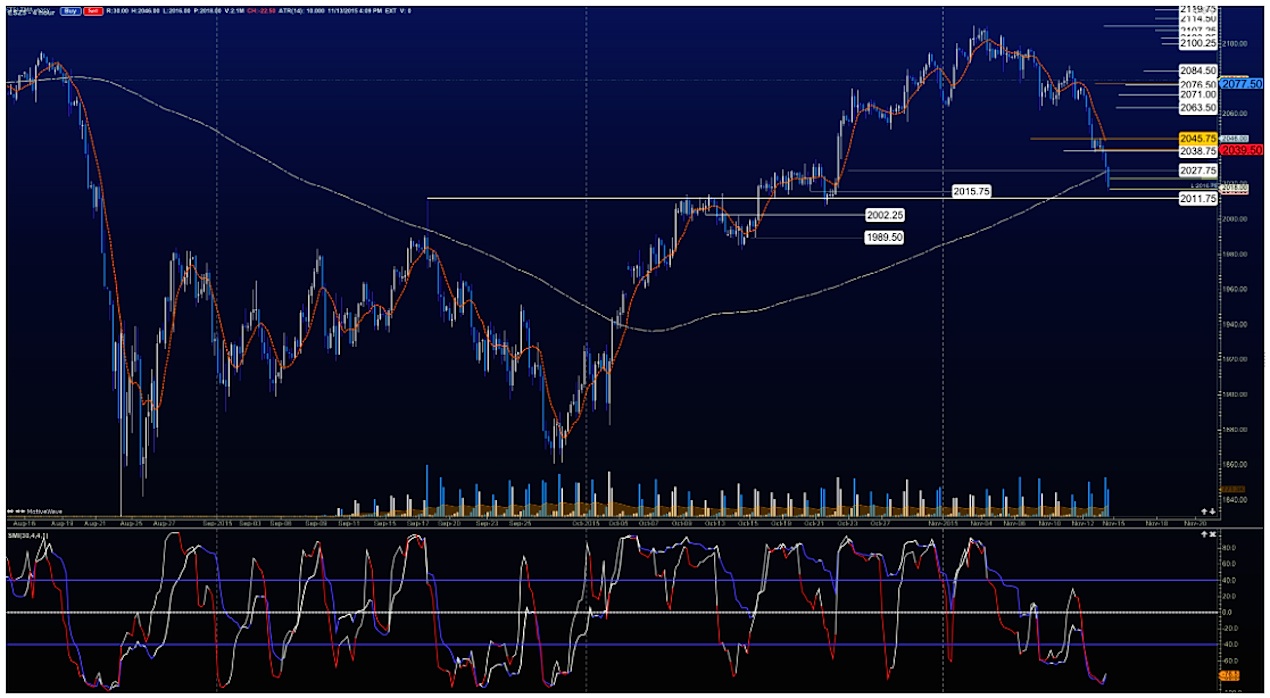
S&P 500 Futures Chart Reference (with upside levels for this week)
Visit TheTradingBook.com for details on intraday and short term swing trading setups, and visit The Trading Vault and SMB Capital to learn how to trade the way I do.
Twitter: @AnneMarieTrades
Any opinions expressed herein are solely those of the author, and do not in any way represent the views or opinions of any other person or entity.


: Creating Bullish Divergence?")


