The S&P 500 futures roared back on Friday to end the day rejecting the very familiar 2092.75 level, only to test it again premarket this morning. A test of the 2045 region (2046.75, to be precise) bought buyers back en masse.
Buyers remain in control of the broad price action, buying the lows at perceived value areas. The FOMC decision still looms ahead, but it seems clear that rates will rise. A breach above 2095.5 should expand and then reject, but will likely come into a higher low as buyers force the charts north in a seasonal move upward.
Longer time frame support still lies near 2045 region for S&P 500 futures, but short term support is much higher at 2083; and near term resistance is near 2095.25 region. Because we are under tepid momentum readings still, breaches on either side of those levels should test and return to their breach levels before continuation. Steep pullbacks remain buy zones in these formations as buyers continue to exert more control.
Watch for the lower highs as a tell tale sign of exhaustion for S&P 500 futures.
Shorter time frame momentum indicators are mixed but rising, and higher than Friday. Longer cycles are flattening, but still in bullish territory, and divergent momentum is continuing to be present upside. The charts have quite a bullish slant but show weakness as far as continuation goes
See today’s economic calendar with a rundown of releases.
Be sure to visit me this Thursday with @Schwab4Traders – you can register here.
RANGE OF MONDAY’S MOTION
Crude Oil (CL_F)
Oil has lost critical support zones near 40. The Saudis did not agree to cut production, as expected, but now the USD has faltered a bit under the Euro holding with limited support expenditures from the ECB, and that makes for muddy spaces. A weak dollar extends to pricing in oil, which might be the reason that the chart is not cascading downward. Weak support sits at 39.15, while resistance lies near 39.8. For an intraday trading formation, we see a range event between these levels noted. Big oil traders remain skittish, and uncertain- caught in a band of ‘hope’ for support as I see it, but most roads point to lower prices ahead. Above a 39.84 retest sends us near 40.1, then 40.35 and 40.68. Below a 39.15 retest sends us to 38.9, 38.6, 38.3, and perhaps 38.05. August lows are on approach, but it will be a choppy road down. Momentum on short time frames is negative but rising. See premium blog for tighter levels.
E-mini S&P Futures (ES_F)
Chart With Still Active S&P 500 Trading Levels
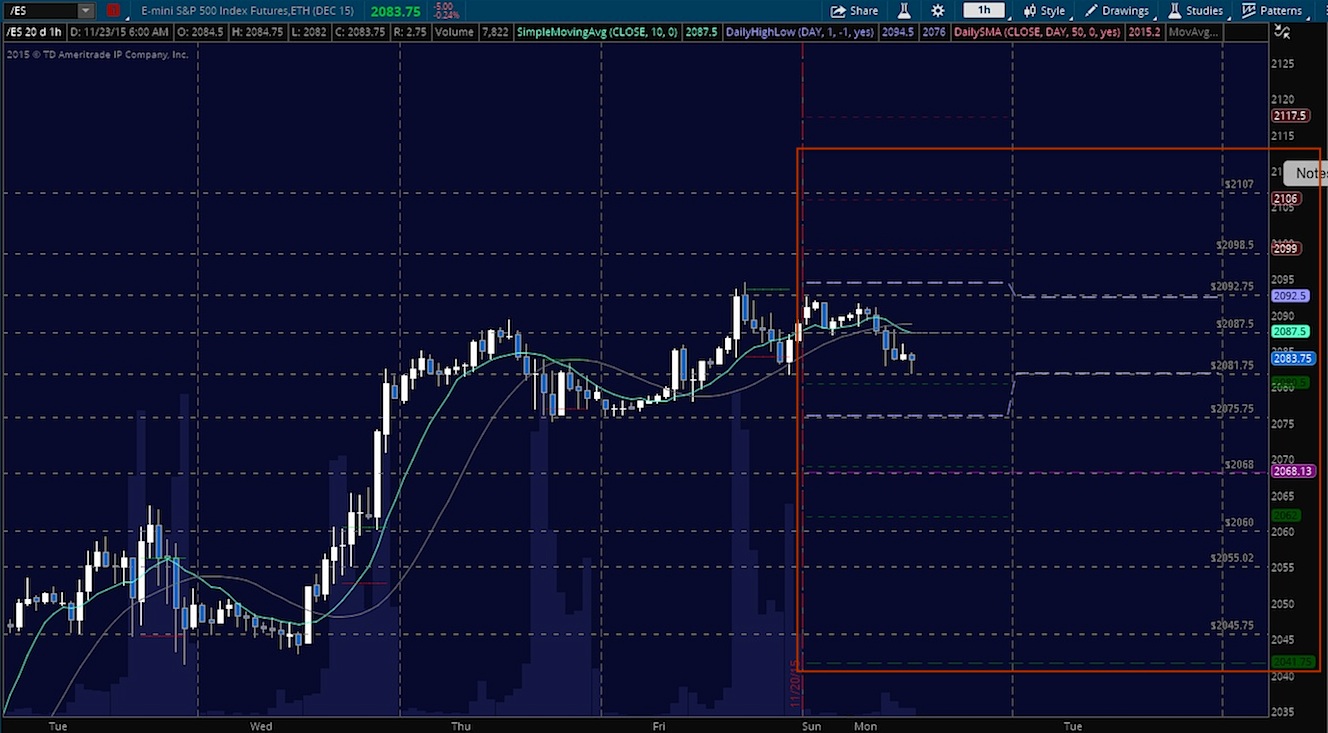
Upside motion is best setup on the bounce off the support line near 2089, or a retest of 2092.75 after a breakout. If the buyers have limited power, the chart will fail to breach and hold 2098.75. A hold of 2089.75 should deliver 2092.25, 2095.25, then 2098.25, 2102.
Downside motion below the failed retest of 2083, or at the failure to hold 2089 opens a short (watch momentum on tight time frames- that would be an aggressive short). [BIG PICTURE NOTE => Short trades should be staged into support and then cautiously watched after some profit is taken, until we fail 2045 on a retest- that level represents a very strong buying support zone for S&P 500 futures. This will keep the chart essentially bullish on larger time frames.] Patterns still look very tired, buyers are using trend and momentum to keep in place the move upward. Retracement into lower levels from 2083 gives us the targets at 2079.75, 2075.5, 2072.25, then 2068.5.
If you’re interested in the live trading room, it is now primarily futures content, though we do track heavily traded stocks and their likely daily trajectories as well – we begin at 9am with a morning report and likely chart movements along with trade setups for the day.
As long as the trader keeps himself aware of support and resistance levels, risk can be very adequately managed to play in either direction as bottom picking remains a behavior pattern that is developing with value buyers and speculative traders.
Twitter: @AnneMarieTrades
Any opinions expressed herein are solely those of the author, and do not in any way represent the views or opinions of any other person or entity.

 Testing Important Price Support")
: Cup (and Maybe Handle) Watch")

