S&P 500 futures (ES_F) continue to fail as weak buyers have faltered under the pressure of new sellers. The target of 2011 was quickly met and the new contract roll has us at lower S&P 500 futures levels again this morning.
The bigger cycles and market structures continue to show a drift into lower support still, but as sellers continue to ramp up, value areas near 1982 become increasingly attractive. Short trades after failed bounces near resistance could reap great gains.
Short term support on the S&P 500 futures contract is now near the 1991 mark; and resistance near 2004.75. Momentum readings are negative and falling intraday – that means we watch for bounces to short, and lower lows to continue after the bounce off support. Steep pullbacks remain buy zones- we are approaching another value area below near 1982. Interim bounce pattern shows at 1995. If the chart fails to bounce and recapture 2000, lower highs and lower lows will hold the pattern in the drift to deeper support.
Short time frame momentum indicators are negative and rising, and higher than Friday. Longer cycles are downward trending, and slipping into neutral territory.
See today’s economic calendar with a rundown of releases.
RANGE OF MONDAY’S MOTION
Crude Oil (CL_F)
Oil prices continue to fail – warm weather exacerbating the issue of high supply levels. Bounces are still getting sold, and signals say they should continue. The trade is still one of supply and demand and it is not ‘crowded’ at all.
Traders are still skittish at these levels, so we could see sharp swings intraday. Support sits at 34.5, while resistance lies near 35.23. For an intraday trading formation, we see a range event between 34.75 and 35.6, noting that momentum and trend are both bearish, and holding. Above a 34.75 retest sends us near 35.37, then 35.57 and perhaps 35.8. Below a 34.5 retest sends us to 34.23, 34 and perhaps 33.59. Momentum on short time frames is negative and falling.
E-mini S&P 500 Futures (ES_F)
This week’s chart with active S&P 500 futures support and resistance trading levels. Click to enlarge.
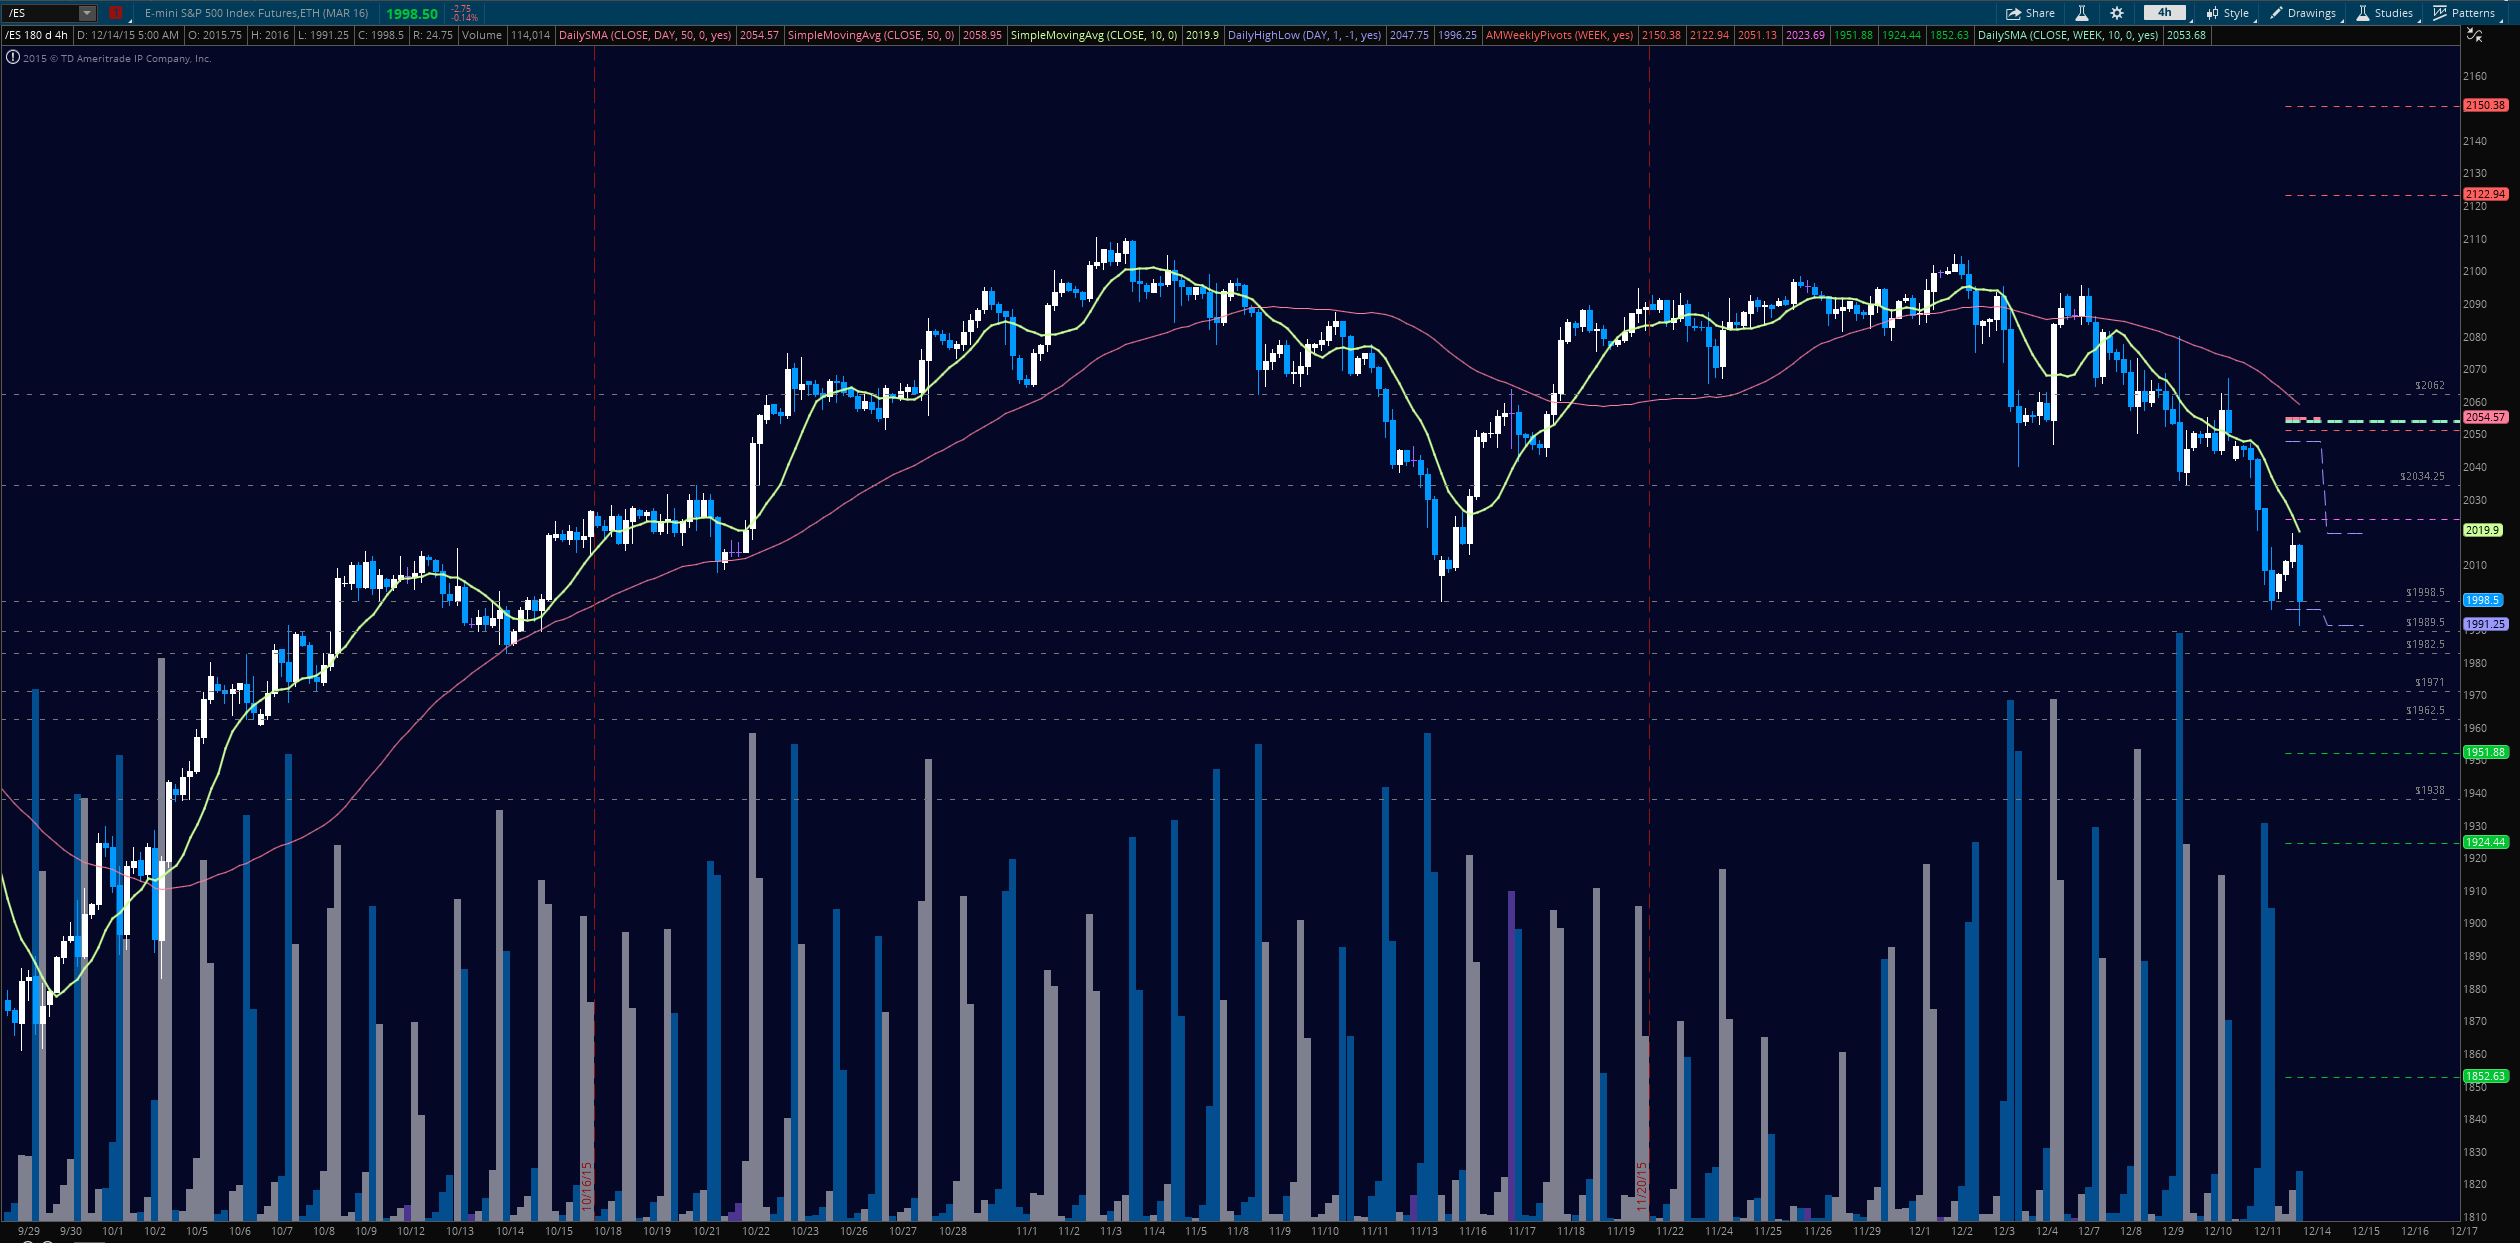
Upside motion is best setup on the bounce off the recapture of 2004.75, or a retest of 1997.25 after a bounce. Sellers are trying to hold control of the area so picking bottoms on the S&P 500 futures are very suspect this morning. Sellers do not seem to feel exhausted yet, but there is a clear momentum shift short term. A hold of 2005 should deliver 2007.25, 2011.5, then 2015.25, 2017.75, and perhaps 2023.5. Again, this represents another countertrend setup with the prevailing negative momentum – but we seem to be attempting reversal at these 1996 levels at the moment.
Downside motion below the failed retest of 2004, or at the failure to hold 1991 opens a short. Retracement into lower S&P 500 futures levels from 2004 gives us the targets at 1998.75, 1996.25, 1994, 1991.75, 1985.75, and 1982.5.
If you’re interested in the live trading room, it is now primarily futures content, though we do track heavily traded stocks and their likely daily trajectories as well – we begin at 9am with a morning report and likely chart movements along with trade setups for the day.
As long as the trader keeps himself aware of support and resistance levels, risk can be very adequately managed to play in either direction as bottom picking remains a behavior pattern that is developing with value buyers and speculative traders.
Twitter: @AnneMarieTrades
Any opinions expressed herein are solely those of the author, and do not in any way represent the views or opinions of any other person or entity.


: Showing Some Signs of Emerging Strength")
