There is a wide range for support and resistance on larger time frames for market futures, as charts have expanded more than 70 points in the S&P 500 futures (ES_F) in two days.
This range of motion on market futures runs from the regions near 1983 and 2051. The bounce that seemed most likely yesterday, did occur, and is continuing. Some gaps filled with some weakness like AAPL, others held in very bullish patterns. We wait on the Fed decision on interest rates, and look at tighter ranges to trade.
Short term support is now near the 2037.5 mark; and resistance near 2051.5. Momentum readings are positive and lifting– that means we watch for bounces to hold after small pullbacks as long as primary support of 2037 holds on the day. Buyers should step in at support. Watch for lower highs to give the signals that the upside is fading for market futures.
Short time frame momentum indicators are positive and rising, and higher than Tuesday. Longer cycles are downward trending, and slipping into negative territory.
See today’s economic calendar with a rundown of releases.
RANGE OF TUESDAY’S MOTION
Crude Oil (CL_F)
Oil bounced hard off the 34.5 region – and the bounce continued into resistance near 37.9. It is now caught in a trading range. We are now looking for the higher low I mentioned yesterday. Intermediate term support still sits at 34.5, but the higher low near 36.5 has shown up. Resistance lies near 38.4, then 39.37, if that is breached and holds. For an intraday trading formation, we see a range event between 36.5 and 37.4, noting that momentum and trend are both bullish, and holding in shorter time frames. Breach above 37.4 retest sends us near 37.7, then 37.9 and perhaps 38.4. Below a 36.5 retest sends us to 36.16, 36.03 and perhaps 35.84. Momentum on short time frames is positive but falling.
E-mini S&P 500 Futures (ES_F)
This week’s chart with active S&P 500 futures support and resistance trading levels. Click to enlarge.
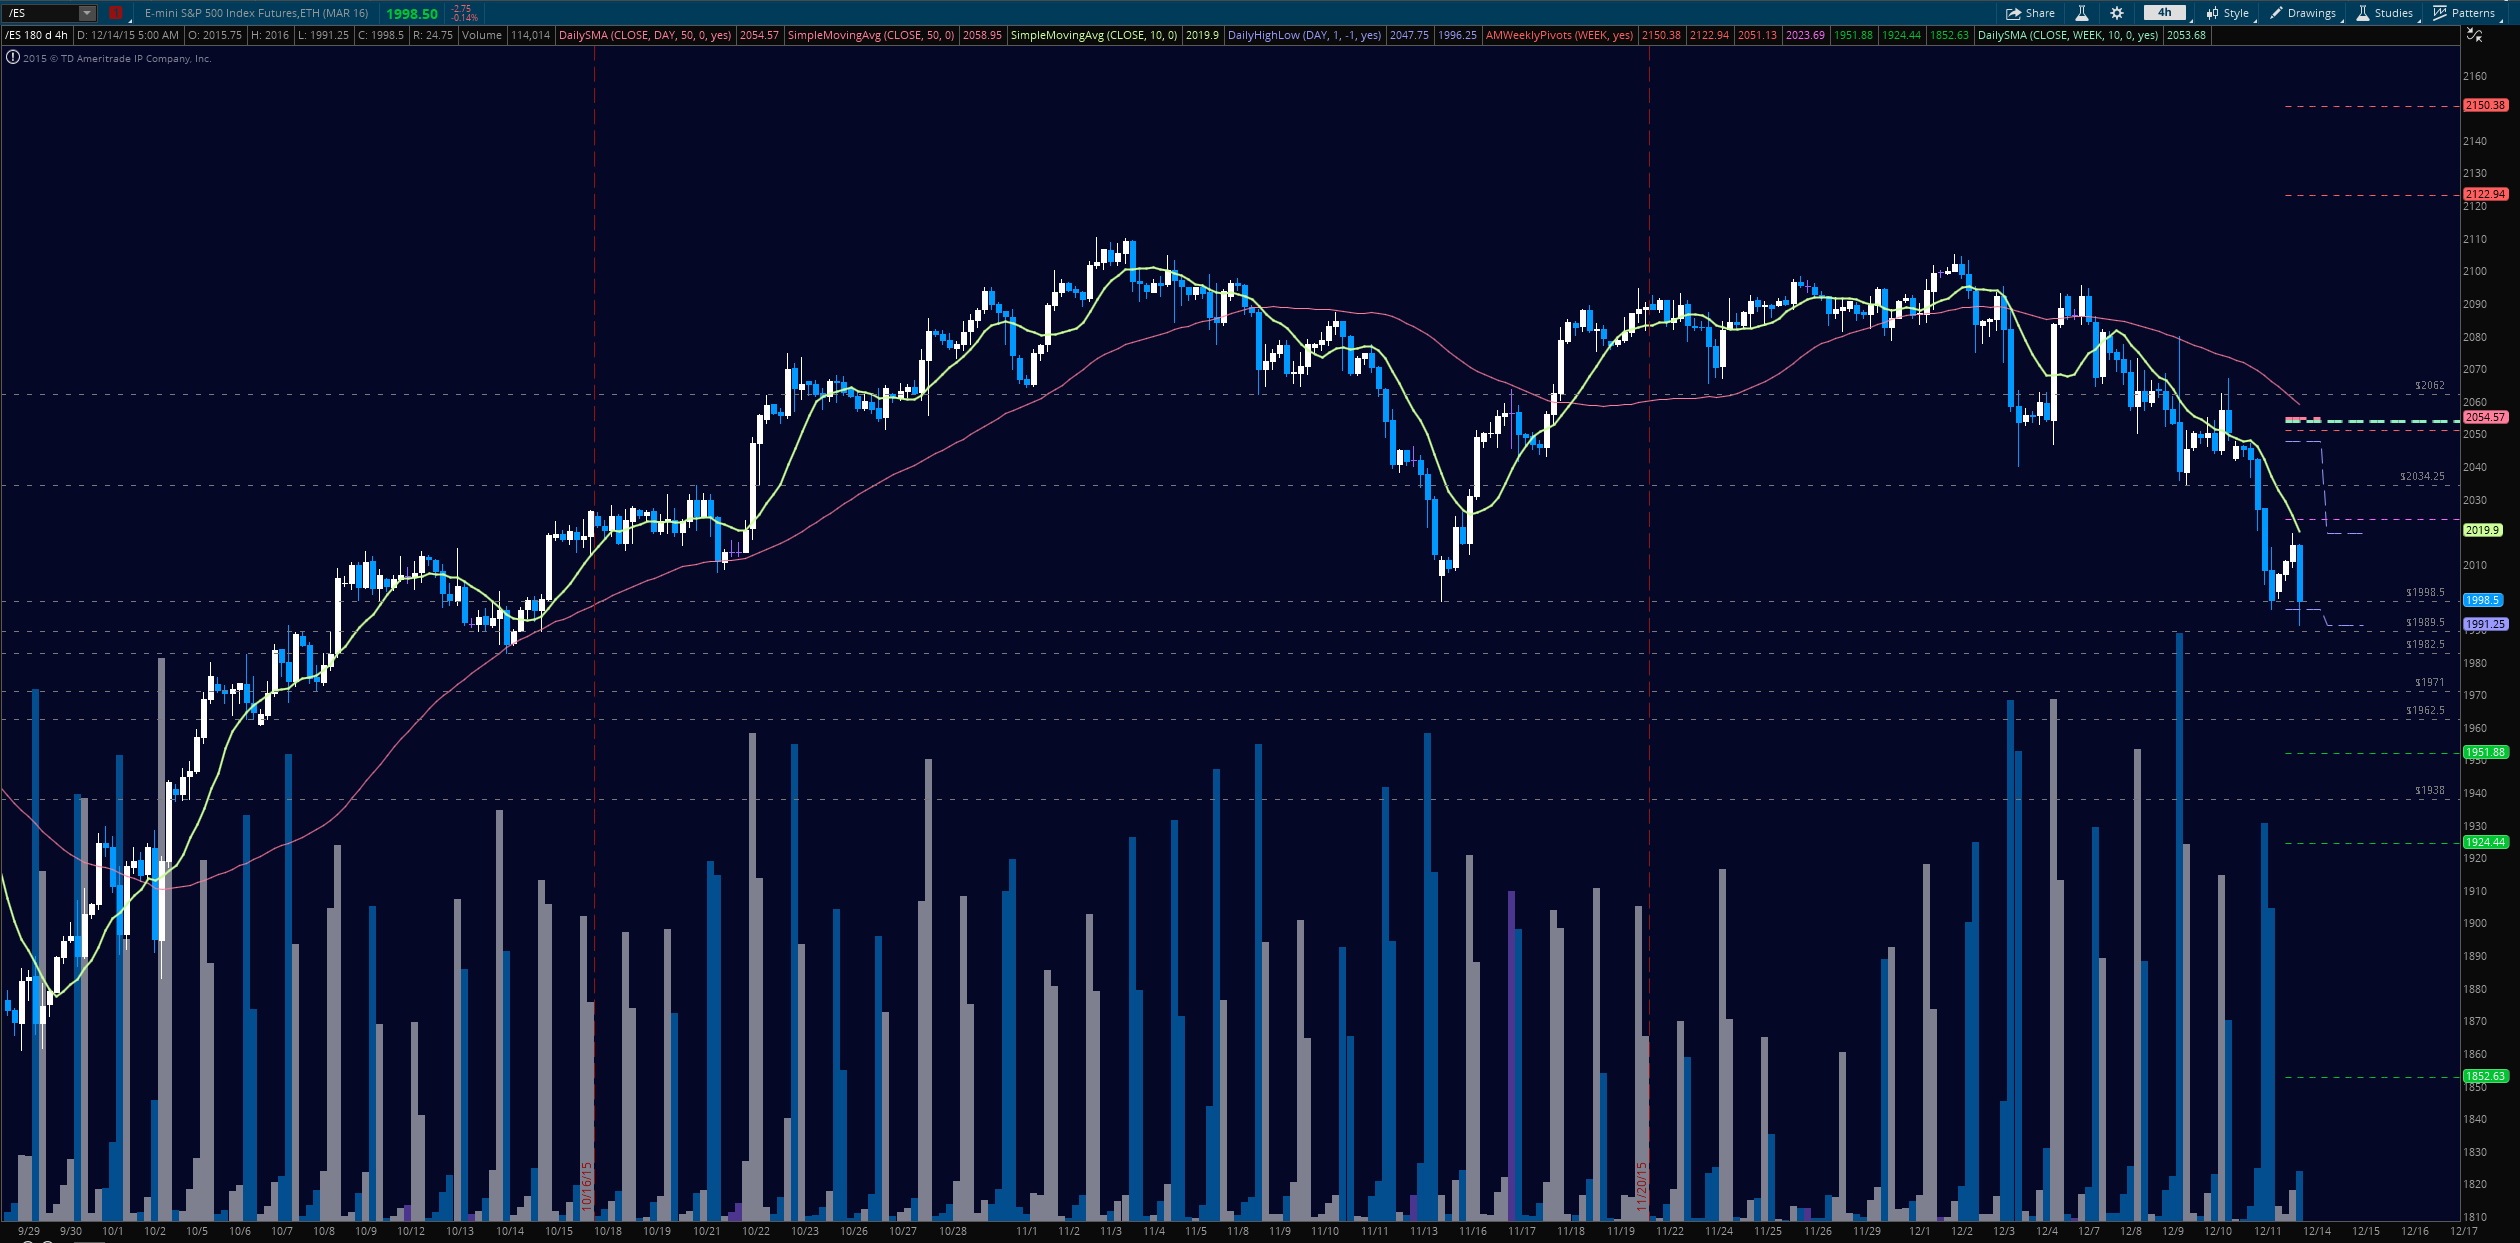
Upside motion on market futures is best setup on the bounce off the recapture of 2040, or a retest of 2046.75 after a breach higher. There is significant resistance near 2051 but if it holds over this level we have a stretch that could see 2064 and higher if the market really expands. A hold of 2046.75 should deliver 2050.5, 2053.25, then 2058.5, 2061.5, and perhaps 2064.25.
Downside motion below the failed retest of 2044, or at the failure to hold 2050 with negative momentum showing opens a short. Retracement into lower levels from 2050 gives us the targets at 2047.75, 2045.75, 2042.5, 2040.25, 2037.5, and 2035.75. Lower levels are likely if the chart collapses, so review the blog for proper levels if the chart moves down.
If you’re interested in the live trading room, it is now primarily market futures content, though we do track heavily traded stocks and their likely daily trajectories as well – we begin at 9am with a morning report and likely chart movements along with trade setups for the day.
As long as the trader keeps himself aware of support and resistance levels, risk can be very adequately managed to play in either direction as bottom picking remains a behavior pattern that is developing with value buyers and speculative traders.
Twitter: @AnneMarieTrades
The author trades futures every day and may have a position in mentioned securities at the time of publication. Any opinions expressed herein are solely those of the author, and do not in any way represent the views or opinions of any other person or entity.
: Creating Bullish Divergence?")


: Creating Bullish Divergence?")