The following is a recap of the recent Commitment Of Traders (COT Report) released by the CFTC (Commodity Futures Trading Commission) looking at COT data and futures positions of non-commercial holdings as of November 8.
Note that the change in COT report data is week-over-week. Excerpts of this blog post originally appeared on Paban’s blog.
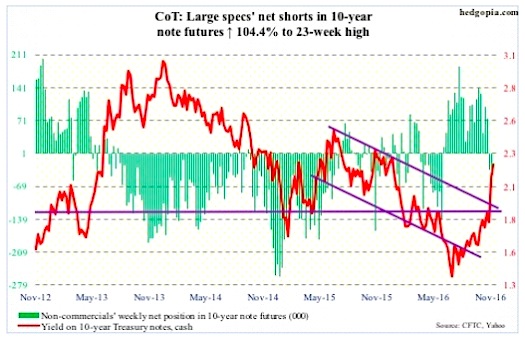
10-year note: The 25-basis-point hike in the Fed funds rate last December was the first in nine-plus years. At 0.4 percent, rates are still zero-bound. Growth remains sluggish, but the economy is in its eighth year of expansion.
During campaign, president-elect Donald Trump has been critical of this ultra-easy monetary policy, and of Janet Yellen, Fed chair.
Markets expect the fed to tighten in December (13-14), but they also expect the bank not to get way too hawkish.
On Wednesday last week, post-election, the yield curve steepened. The 10-year yield shot up 21 basis points to 2.07 percent, rising further by Monday to an intra-day high of 2.27 percent – the highest since December last year. The long end of the curve is beginning to smell reflation thanks to Mr. Trump’s focus on infrastructure spending.
In this scenario, the Fed has room to get hawkish – not only to pacify Mr. Trump but also to fill its monetary quiver with conventional arrows. Plus, there are two vacancies in the board of governors that he can fill, which potentially changes the board’s complexion going forward.
Commitment of Traders data: Currently net short 71.7k, up 36.6k.
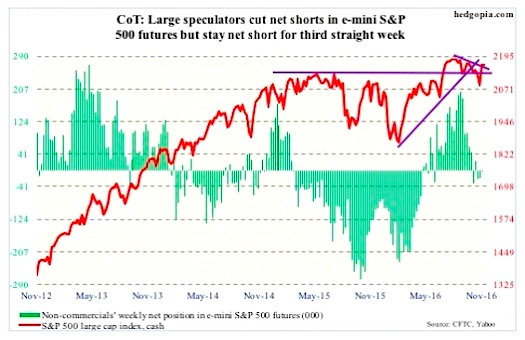
E-mini S&P 500: On Wednesday morning last week, as it was increasingly becoming apparent that Mr. Trump would pull an upset victory, the Dow Industrials was down 800-plus points, while the S&P large cap index hit limit down. Buyers then gradually showed up, and the pace quickened as the president-elect began his acceptance speech and particularly when he emphasized the need for infrastructure spending. All this took place pre-open; in the regular session, the index rose 1.1 percent.
On pre-election Friday, the S&P 500 closed right on its rising 200-day moving average. On Wednesday last week, it shot past the now-slightly-declining 50-day moving average, and 2120 was recaptured.
That said, Thursday produced a long-legged doji near the upper Bollinger band. That session was also a backtest of the broken trend line from February this year. This is a perfect spot for things to pause/reverse – at least near term. Monday produced a spinning top.
Leading up to this, in the week through Wednesday last week, the SPDR S&P 500 ETF (NYSEARCA:SPY), saw huge inflows of $5.5 billion (courtesy of ETF.com). This was followed by another $7.7 billion on Thursday and Friday, with the cash going nowhere in those two sessions.
In the same week, $265 million moved into U.S.-based equity funds (courtesy of Lipper). In the prior five, $36 billion was redeemed.
Commitment of Traders data: Currently net short 3.3k, down 17.4k.
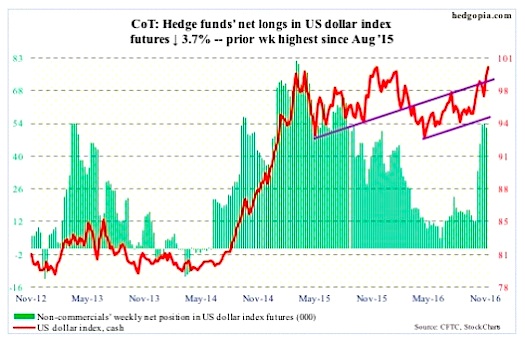
US Dollar Index: After a nine-month, 25-percent rally into the March 2015 high of 100.71, the US Dollar Index has been range-bound, with a slightly declining trend line from that high obstructing rally attempts. That trend line got kissed from underneath last week, and was taken out yesterday. At 100.12, the US Dollar is within spitting distance of the March 2015 high.
It is hard to tell which way non-commercials are leaning, as their holdings do not reflect post-election reaction in the currency market. That said, they hold substantially fewer net longs versus what they held near the March 2015 high.
Commitment of Traders data: Currently net long 52.3k, down 2k.
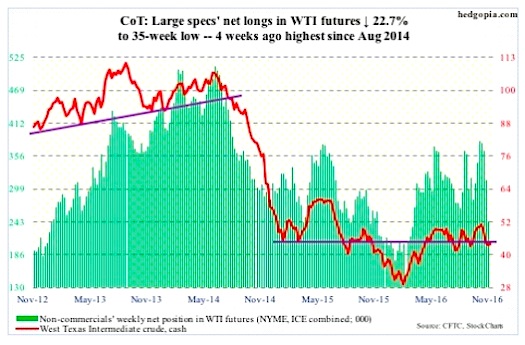
Crude oil: During Wednesday’s (last week) wild trading, spot West Texas Intermediate crude oil whipsawed between $43.07/barrel and $45.95, in the end rallying 0.6 percent to $45.27. Support at $43-plus goes back to January 2015. During the session, the spot also briefly lost the 200-day moving average before recapturing it. Daily technicals are oversold. The 50-day moving average lies at $47.24 for crude oil prices.
In the EIA report out on Wednesday, traders for the second week focused on the positives.
Gasoline and distillate stocks dropped – by 2.8 million barrels and 1.9 million barrels to 221 million barrels and 148.6 million barrels, respectively. Gasoline stocks were the lowest since mid-December last year, and distillates the lowest since early December last year.
Crude oil imports fell by 1.6 million barrels per day to 7.4 mb/d. And refinery utilization rose by 1.9 percentage points to 87.1 – a five-week high.
On the other hand, crude stocks increased by 2.4 million barrels to 485 million barrels, to a 10-week high. Stocks have gone up by nearly 17 million barrels in the past couple of weeks.
In the most recent sell-off, the spot broke a rising trend line from February this year, as well as support at $46, which oil bulls need to recapture to rebuild momentum.
Commitment of Traders data: Currently net long 242.9k, down 71.4k.
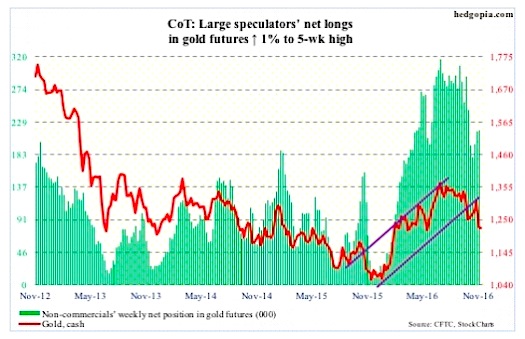
Gold: The spot had a rollercoaster ride on Wednesday last week – closed at $1,273.5, down 0.1 percent, with a high of $1,338.3 and a low of $1,268.1. The session high kissed the underside of the falling trend line drawn from the July 6th high of $1,377.5 and was rejected. Both 50- and 200-day moving averages were lost, as well as support at $1,300.
The SPDR Gold ETF (NYSEARCA:GLD), is not succeeding in attracting funds as it was early this year. In the week through Wednesday last week, $419 million came in, but on Thursday and Friday $840 million was redeemed (courtesy of ETF.com). From October 7 when the metal began its latest rally attempt through last Friday, $528 million came out of the ETF.
Commitment of Traders data: Currently net long 217.2k, up 2.1k.
Thanks for reading.
Twitter: @hedgopia
Author may hold a position in mentioned securities at the time of publication. Any opinions expressed herein are solely those of the author, and do not in any way represent the views or opinions of any other person or entity.

: Cup (and Maybe Handle) Watch")
 Reaches Important Price Support")

