The following is a recap of The COT Report (Commitment Of Traders) released by the CFTC (Commodity Futures Trading Commission) looking at futures positions of non-commercial holdings as of November 3, 2015. Note that the change in the November 3 COT report data is week-over-week.
10-Year Treasury Note: Three prominent Federal Reserve officials tried to convince the markets this week that a December interest rate hike was in play in earnest.
Testifying before the House Financial Services Committee on Wednesday, Janet Yellen, Federal Reserve chair, said “December would be a live possibility” for first rate increase. Later that day, Mr. Dudley, president of the New York Federal Reserve, described December as a “live possibility.” Later in the evening, Stanley Fischer, Federal Reserve vice chair, said the Fed may quickly meet its two-percent target once the price of oil stabilizes and the dollar stops rising – the implication being he is comfortable moving now although inflation is below their target.
Of course, they all qualified their statements by as Mr. Dudley put it “but let’s see what the data shows.”
Data have spoken – at least the ones the “data dependent” Fed is focused on. October showed non-farm job gains of 271,000, unemployment rate of five percent, and 2.5-percent year-over-year increase in average hourly earnings of private-sector employees – at the highest pace since July 2009.
Pre-jobs report, two-year Treasury bills were already yielding 0.85 percent on Thursday – matching the highs of April 2011 – breaking out of nine-month resistance at 0.74 percent. Friday, it shot up to 0.9 percent.
Thus far, the long end of the curve is tagging along, with 10-year yields rising 18 basis points and 30-year yields up 16 basis points for the week. The long end is not panicking just yet, though the curve did flatten a bit. Should the long end begin to falter, that will be a warning sign – the bond market essentially saying the economy is not in a position to handle higher rates – as there are tons of reasons for the Fed to not move.
Now that the genie is out of the bottle, the only excuse for not moving in December is if stocks take a tumble into the December 15th-16th FOMC meeting or the November jobs report is a big disappointment.
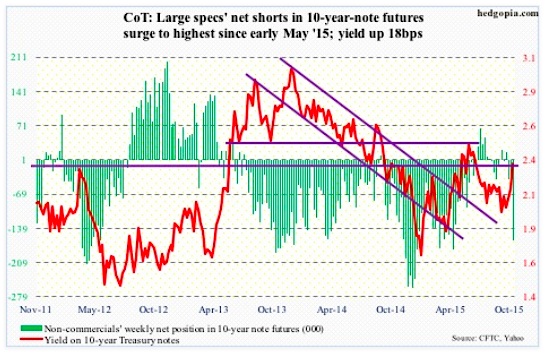
Non-commercials are beginning to bet that an interest rate hike is coming in December. Per the latest COT report data, net shorts rose to the highest since early May.
November 3 COT Report: Currently net short 164.3k, up 128.6k.
30-Year Treasury Bond: Next week’s major economic releases are as follows.
Tuesday, the National Federation of Independent Business publishes its optimism index for October. September was 96.1, up from 95.9 in August. But it peaked last December at 100.4, which was the highest since October 2006. At 16, small businesses’ comp plans were the highest since 17 in December.
Thursday, the JOLTS report for September comes out. August saw a drop in non-farm job openings from 5.67 million in July to 5.37 million. July was also revised lower from 5.75 million.
Friday, we have retail sales for October, the University of Michigan’s consumer sentiment index for November, and October’s PPI-FD.
Retail sales are still growing year-over-year, but growth has decelerated quite a bit. In September, they grew 2.4 percent, and were growing at 4.9 percent in August last year.
The final reading of consumer sentiment in October was 90, up from 87.2 in September. Sentiment has been under pressure since reaching 98.1 in January this year.
Producer prices in September fell 0.5 percent – the biggest decline in eight months. In the 12 months through September, the PPI fell 1.1 percent. Core PPI fell 0.3 percent in September month-over-month and rose 0.5 percent in the 12 months through September. Not much pricing pressure for producers.
Six FOMC members are scheduled to speak on weekdays. Last week, there were eight.
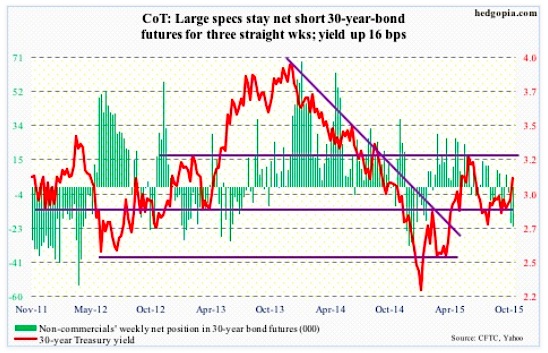
November 3 COT Report: Currently net short 21.9k, up 1.7k.
Crude Oil: The $47-$48 resistance proved too tough to crack after all. On both Tuesday and Wednesday, spot West Texas Intermediate crude oil attacked that level, only to get repelled. What’s next? Support resides at $43. Is that in play again for crude oil?
On Wednesday in particular, oil bulls were disappointed with news on crude inventory.
For the week ended October 30th, stocks of crude oil rose by 2.8 million barrels, to 482.8 million barrels – the highest since the May 8th week. This was the sixth straight weekly increase.
Crude oil production, too, rose by 48,000 barrels a day, to 9.16 million barrels a day – a four-week high. Production peaked at 9.61 mb/d in the June 5th week.
On other fronts, news was not all that bad.
Refinery utilization rose further, to 88.7 percent. It has now risen 2.7 percentage points since October 9th. Utilization peaked at 96.1 percent in the August 7th week… Gasoline inventory fell by 3.3 million barrels, to 215.3 million barrels – an eight-week low…Distillate stocks dropped 1.3 million barrels, to 140.8 million barrels – a 17-week low… Crude oil imports fell further, by 89,000 barrels a day, to 6.9 mb/d – the lowest since the June 19th week.
With the four-percent drop this week, WTI crude oil also lost its 50-day moving average, still rising but likely to now provide resistance. The lower Bollinger band lies at $43-plus, which also corresponds to two-month support. Let’s see if buyers show up near that support.
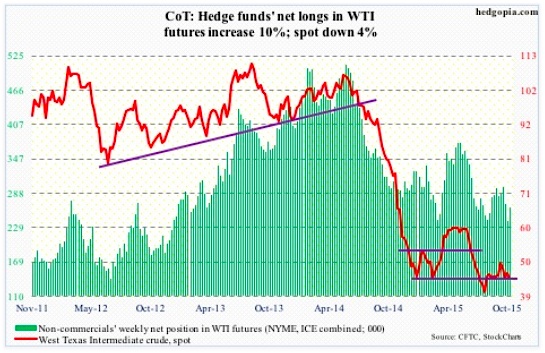
Non-commercials are not giving up, as net longs increased in the latest COT report data.
November 3 COT Report: Currently net long 263.1k, up 23.4k.
E-mini S&P 500: U.S.-based equity funds attracted $5.7 billion more in the week ended Wednesday (courtesy of Lipper). With this, since the week ended September 30th, cumulative inflows have totaled $12 billion.
Equity bulls should also take heart from the fact that this is money willing to buy stocks at progressively higher multiples.
Right before the S&P 500 Index collapsed by 11 percent in five sessions back in August, 3Q15 operating earnings estimates of S&P 500 companies stood at $28.93. The index was trading at 19.5x trailing 12-month earnings back then. These estimates have now been chopped further down to $24.93; the index on Friday traded at 20.3x.
Money that left back then using valuation as an excuse is not going to get in now. Earnings are dropping and stocks are rising. Not a healthy combo.
That said, as long as flows continue, multiples will expand for stocks.
Near-term, the S&P 500 looks vulnerable. Important sectors such as consumer discretionary are giving out signs of fatigue.
Support is galore – 200-day moving average (2063), 2040, 2020, 50-day moving average (1997). If these levels attract new money, wanting to get in to benefit from favorable seasonality, then shorts may be in for more pain. Short interest remains high, and has already provided a big tailwind for stocks since the September 29th low.
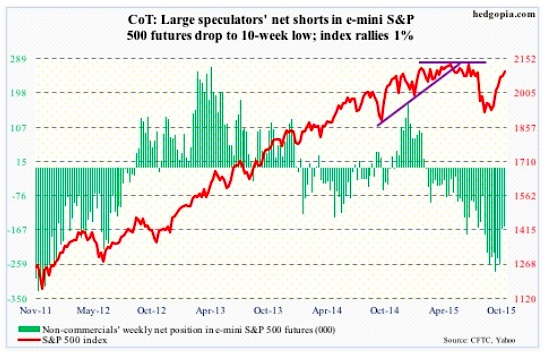
November 3 COT Report: Currently net short 157.6k, down 8.4k.
continue reading about Gold, the Dollar, and more on the next page…


