Refinery utilization also fell 1.1 percentage point to 89.8 – the first sub-90 reading since March this year. But Cushing saw a drawdown of a million barrel. And crude oil production fell by 40,000 barrels a day, to 9.1 million barrels per day. Production peaked at 9.61 mb/d in the June 5th week. Further, in the week ended October 2, oil rigs went down by 26, to 614 – the least since August 2010. The all-time high was 1,609 in October last year.
If not for Friday, spot WTI would have been down for the week – was up 1.4 percent in the session. The Wednesday news of Russian airstrikes in Syria was no help to crude oil prices.
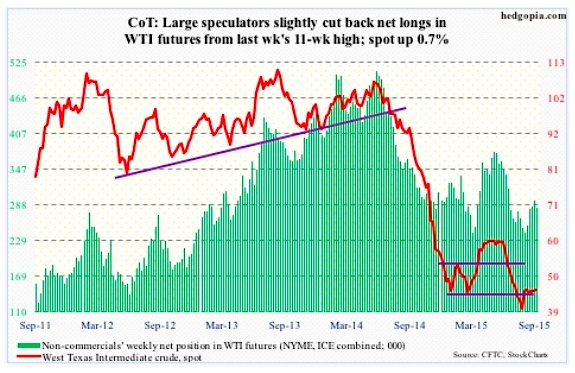
The Friday action is encouraging as once again buyers showed up to defend the 43-44 support. With that said, the 13-week exponential moving average, which is still pointing lower, once again proved tough to crack. This was the third straight week and four out of the last five that this average repelled a rally attempt by crude oil. There are now three back-to-back weekly dojis. A break is coming – either up or down.
Non-commercials slightly cut back, but do have sizable positions.
September 29 COT Report: Currently net long 283.2k, down 12.6k.
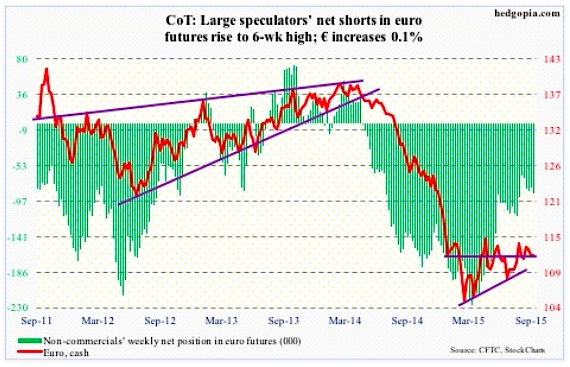
Euro: In September, for the first time in six months the euro area’s inflation rate turned negative – down 0.1 percent. Totally unexpected! The Euro reacted by dropping 0.7 percent on Wednesday. Earlier on Monday it completely ignored Spain’s election results, as buyers snapped up intra-day weakness near the 50-day moving average. That average continues to move up, and a golden cross is just around the corner, with a mere 0.30 separating the two averages. The technical picture improves if the euro can get over 114.40ish. Having said that, it was unable to hang on to Friday’s gains (rose as high as 113.19, before closing at 112.1).
Non-commercials continue to lean bearish, though not to the extent they were early this year.
September 29 COT Report: Currently net short 87.7k, up 6.6k.
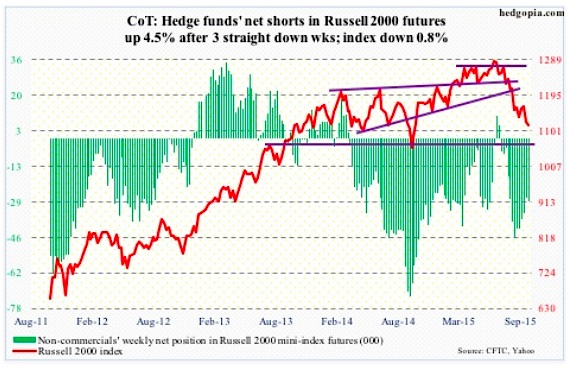
Russell 2000 mini-Index: Just so we are not oblivious to the tough macro environment and get overly bulled up on stocks here, I’ll offer up a little reminder from Fitch Ratings: It said the trailing 12-month leveraged loan default rate inched up to 1.5 percent in August, up from 1.4 percent for much of this year, further adding that it could near two percent this fall. Worryingly, many of the recent loan defaults did not come from the energy, precious metals or mining sectors.
On Friday, as did other major U.S. stock market indices, the Russell 2000 had an impressive intra-day reversal. The Russell 2000 Volatility Index (RVX) is literally sitting on its 50-day moving average and is likely headed toward the 200-day moving average, which is nearly four points lower.
September 29 COT Report: Currently net short 29k, up 1.2k.
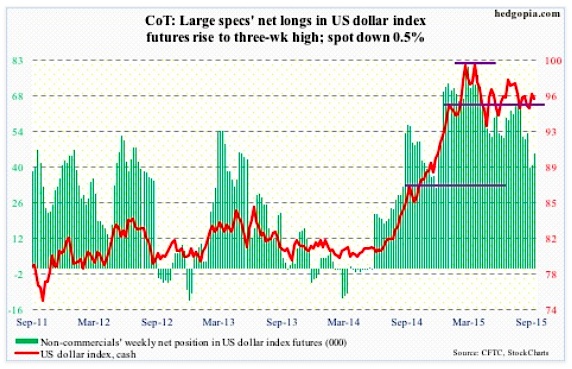
US Dollar Index: For the eight sessions ended Thursday, the US Dollar Index was literally sitting right underneath its 50- and 150-day moving averages. Then came Friday’s jobs report, which led to a dramatic shift in the fed funds futures curve. Interest rates across the yield curve took it on the chin. The US dollar reacted, dropping 0.4 percent for the session (was down 1.1 percent at one time). If there is any consolation for dollar bulls, it is that the 200-day moving average was not violated. So it continues to remain trapped between 50- and 200-day moving averages.
Non-commercials do not fancy the buck as much as they back in March, according to COT Report data.
September 29 COT Report: Currently net long 45.7k, up 4.9k.
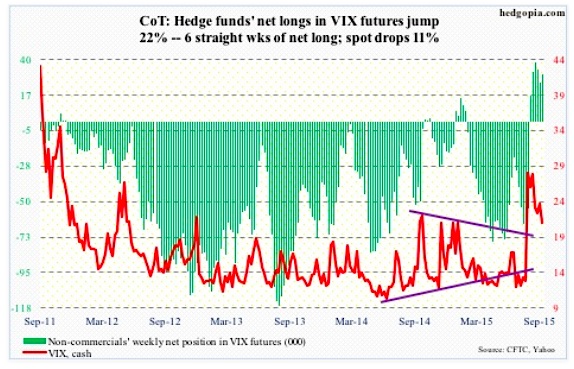
VIX: Non-commercials have stayed net long for six straight weeks, during which the spot Volatility Index (VIX) contracted by north of seven points. With that said, in the very first week they went net long, the spot did spike to 53.29 (August 24th) before reversing.
The spot is literally sitting on the 50-day moving average. Stock market bulls would have scored a major victory – at least near-term – if they can push the spot below that average, which looks likely.
September 29 COT Report: Currently net long 30.2k, up 5.4k.
Thanks for reading.
Twitter: @hedgopia
Read more from Paban on his blog.
No position in any of the mentioned securities at the time of publication. Any opinions expressed herein are solely those of the author, and do not in any way represent the views or opinions of any other person or entity.


