The following are charts and data showing non-commercial futures trading positions as of October 17, 2017.
This data was released with the October 20 Commitment of Traders Report (COT). Note that these charts also appeared on my blog.
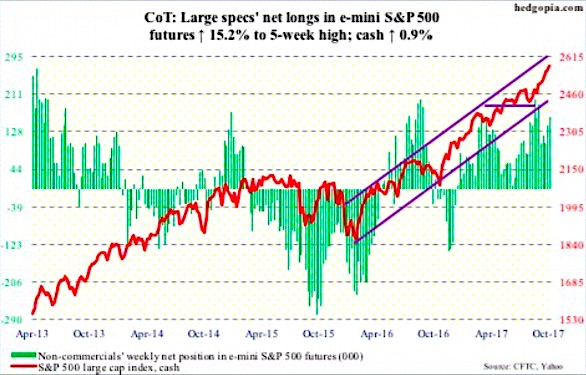
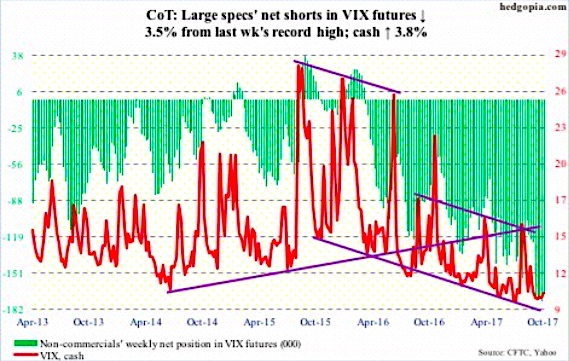
The charts below looks at non-commercial futures trading positions for the S&P 500 (INDEXSP:.INX) and VIX Volatility Index (INDEXCBOE:VIX).
E-mini S&P 500: Currently net long 161.9k, up 21.4k.
Buy-the-dip is alive and well.
Last Thursday saw the cash come under pressure – was down 0.5 percent initially – but dip-buyers showed up in the very first half hour. The session ended flat, with a test of the 10-day intraday. This was followed by a 0.5-percent rally Friday, to a fresh high.
Thursday’s action was preceded by healthy inflows. In the week ended Wednesday, $5.4 billion moved into U.S.-based equity funds, following inflows of $2.9 billion in the prior week (courtesy of Lipper).
In the same week, a total of $6.1 billion moved into three S&P 500-focused ETF’s, with SPDR S&P 500 ETF (SPY) taking in $5.2 billion, Vanguard S&P 500 ETF (VOO) $470 million and iShares core S&P 500 ETF (IVV) $475 million (data courtesy of ETF.com).
Sentiment continues to remain effusive. For the second week running, Investors Intelligence bulls were 60 percent or higher. As complacent as it looks, they deserve kudos for being on the right side of trade – more so if they are nimble enough to exit when momentum reverses.
VIX Volatility Index Futures: Currently net short 168.6k, down 6.1k.
In a typical sign of the times, the VIX Volatility Index rallied to 11.77 intraday Thursday but only to close down 0.02 to 10.05. Intraday in that session, it rallied past both the 50- and 200-day moving average, before volatility bears saw it as an opportunity to sell vol.
The bulls need to save shorter-term moving averages, with the 10- and 20-day at 10.01 and 9.84, respectively. This was more or less achieved Friday, as intraday VIX dropped to as low as 9.29. The session produced a dragonfly doji, following Thursday’s gravestone dojj – two contrasting signals back-to-back.
Thanks for reading.
Twitter: @hedgopia
Author may hold a position in mentioned securities at the time of publication. Any opinions expressed herein are solely those of the author, and do not in any way represent the views or opinions of any other person or entity.


