The following are non-commercial futures trading positions as of May 30, 2017.
Note that the data were released in the June 2 COT Report (Commitment of Traders).
Below are 3 charts of futures trading positions for commodities traders, including Crude Oil, Gold, and the US Dollar.
Crude oil: Currently net long 434.8k, up 23k.
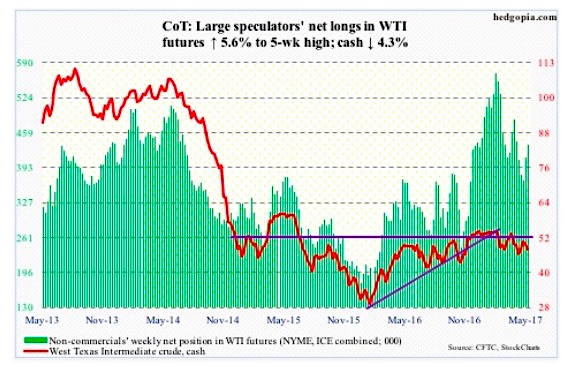
In the EIA report out Wednesday, positives outweighed negatives, but this was no help to spot West Texas Intermediate crude oil. It fell 2.7 percent in that session – rejected at the 200-day moving average.
Having rallied big into last week’s decision by OPEC/non-OPEC to extend the existing production cutback agreement by another nine months until 1Q18, oil prices suffered a classic ‘buy the rumor, sell the news’ phenomenon.
Friday was down 1.5 percent, but support at $47 was tested and held – a must-save for near-term momentum.
For the week ended May 26, stocks of crude fell 6.4 million barrels to 509.9 million barrels – now down 25.6 million barrels from record high 535.5 million barrels eight weeks ago.
Gasoline inventory fell, too – down 2.9 million barrels to 237 million barrels. As did crude imports, which fell 309,000 barrels per day to 7.99 million b/d.
Refinery utilization expanded 1.5 percentage points to 95 percent – the highest since August 2015. Although the path of least resistance from these levels is down.
Oil production continued to rise – up 22,000 b/d to 9.34 mb/d. Since OPEC reached a cutback agreement late November last year, U.S. crude oil production has increased by 643,000 b/d.
Distillate stocks rose 394,000 barrels to 146.7 million barrels.
Gold: Currently net long 167.1k, up 7.3k.
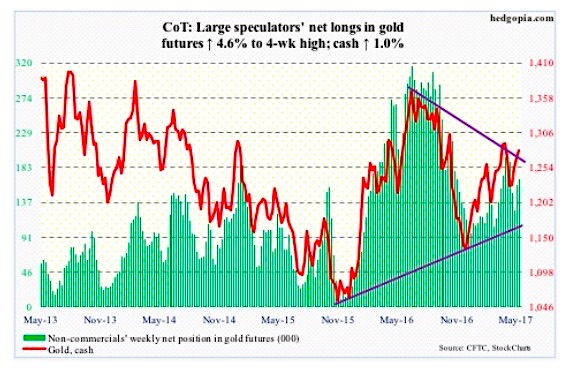
Friday, gold poked its head out of a falling trend line from last July. This is potentially important, although it is not a clean breakout yet.
Gold ($1,280.2) has remained trapped between that trend line and a rising one from last December. This is perhaps why traders/investors have been on the sidelines.
In the week ended Wednesday, GLD, the SPDR gold ETF (NYSEARCA:GLD), saw no activity whatsoever. This was the second such week in the last three (courtesy of ETF.com).
The daily chart is overbought. And there is support underneath, with the 50-day at $1,257.31 and the 200-day at $1,245.92.
US Dollar Index: Currently net long 27.7k, down 3.6k.
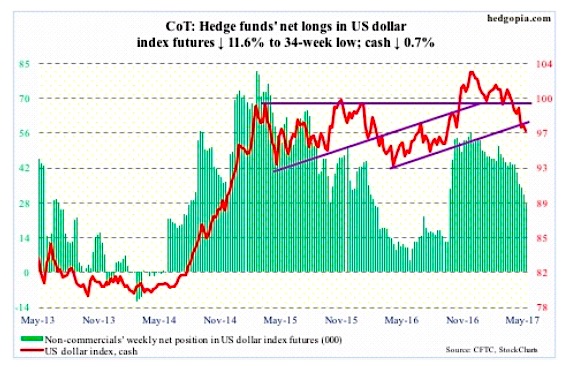
The US Dollar Index (96.67) has been trading more or less sideways the past couple of weeks, with the 10-day having resisted rally attempts the past five sessions.
From the intraday high on January 3, the US Dollar Index has dropped nearly seven percent this year. The Friday low approximated the bottom of a five-month downward-sloping channel. Bulls hope this holds.
Resistance above is plentiful. The 50-day lies at 99 and the 200-day at 99.19.
Non-commercials continue to show disinterest, having cut net longs to a 34-week low.
Thanks for reading.
Twitter: @hedgopia
Author may hold a position in mentioned securities at the time of publication. Any opinions expressed herein are solely those of the author, and do not in any way represent the views or opinions of any other person or entity.

: Showing Some Signs of Emerging Strength")
