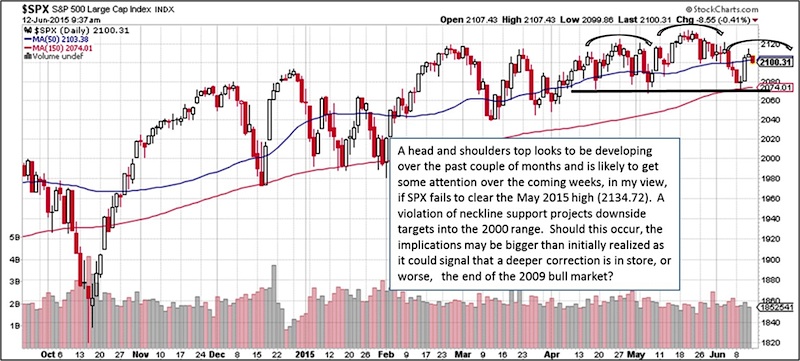
I suspect that some chatter among the technical crowd may begin to develop about the potentially bearish pattern that appears to be developing on the S&P 500 Index (SPX). This pattern is commonly known as a head and shoulders top and it seems to me that a neckline support has been firmed up earlier this week as the S&P 500 landed support near the 5/6/15 low of 2067.93. See the S&P 500 chart below for reference.
There are two things to keep in mind about these patterns, which add to their predictive value:
1) The height of the pattern, in this case 66.79 points, helps determine downside projections, and
2) The width of the pattern assists in timing the call as a symmetrical pattern suggests that the right shoulder may still need another 3-4 weeks to develop.
A violation of neckline support projects downside targets into the 2000 range. Should this occur, the implications may be bigger than initially realized as it could signal that a deeper correction is in store, or worse, the end of the 2009 bull market? Why?
S&P 500 Chart – Head And Shoulders Pattern?
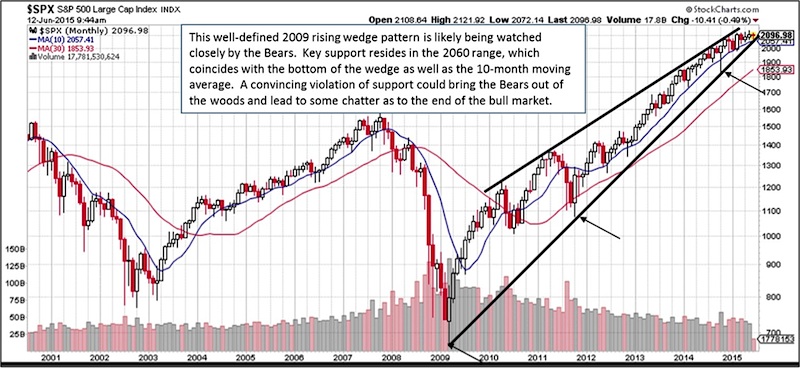
The longer-term monthly S&P 500 chart below gives a good indication of the dominant trend during the span of this 6+ year bull market. One can see that there is a well-defined 2009 rising wedge pattern on the logarithmic chart and it is likely being watched very closely by the Bears. Key support resides in the 2060 range, which coincides with the bottom of the wedge as well as the 10-month moving average. A convincing violation of support suggests a potential change in the longer-term direction of the S&P 500 and it could bring the Bears out of the woods, leading to some chatter as to the end of the bull market. This could also mean that we may not be in store for a slow summer.
S&P 500 Chart – Rising Wedge Pattern?
Thanks for reading and have a great weekend.
As a personal disclosure, I do not own or have a direct financial interest in any security mentioned. Although I am affiliated with T3 Trading Group LLC, opinions reflected are my own and should not be considered as investment advice.
Twitter: @jbeckinvest
Any opinions expressed herein are solely those of the author, and do not in any way represent the views or opinions of any other person or entity.

: Showing Some Signs of Emerging Strength")
